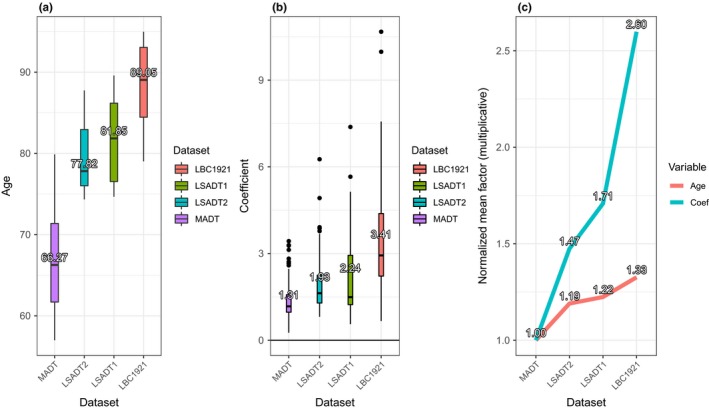
Figure 2.

Plots displaying accelerated increase in DNA methylation by significantly hypermethylated CpGs (FDR <0.05) in the four cohorts ordered by increasing mean age. The boxplots in 2a and 2b show the distribution of sample ages and regression coefficients of hypermethylated CpGs in each cohort. Acceleration in DNA hypermethylation with increasing age is clearly illustrated by plotting, for each cohort, the means of ages and means of regression coefficients normalized by MADT (2c)
