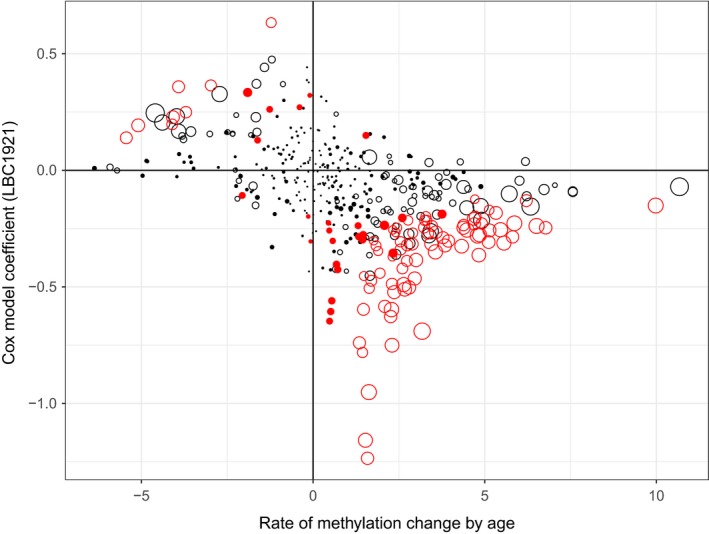
Figure 3.

Scatterplot displaying relationship between age‐related rate of change in DNA methylation and mortality. The empty dots are CpGs significantly methylated with age (FDR <0.05, the larger the dots the higher the statistical significance). The red dots are CpGs associated with mortality with p < 0.05 in the Cox regression model. The figure shows that age‐associated CpGs predominantly contribute to reduced risk of death
