
Figure 2.
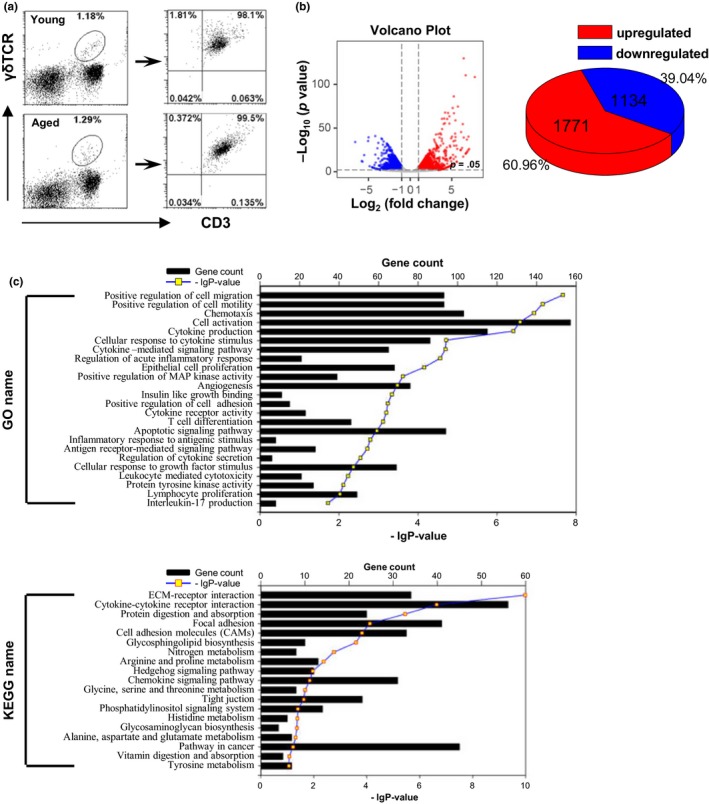
The gene expression of lung γδT cells was distinguished between aged and young mice. (a) γδT cells (CD3+ γδTCR+) were purified from lung MNCs (20 mice/sample) and detected using FACS. Purified γδT cells were analyzed through mRNA sequencing. (b) The Volcano plots based on the fold change and p value showed the differential expression of the indicated genes. The two vertical lines correspond to a twofold change in expression. The horizontal line indicates p = .05. Red plots represent the upregulated genes. Blue plots represent the downregulated genes. The pie chart shows the distribution of DEGs in the aged group compared with young group. (c) The list of DEGs was converted into Entrez‐IDs for GO and KEGG analyses with r 3.2.3 using the library gostats 2.34.0 and the R bioconductor genomewide mouse annotations from the package org.Mm.eg.db (version 3.3.0). DEGs, differentially expressed genes; FACS, fluorescence‐activated cell sorting; GO, Gene Ontology; KEGG, Kyoto Encyclopedia of Genes and Genomes; MNCs, mononuclear cells