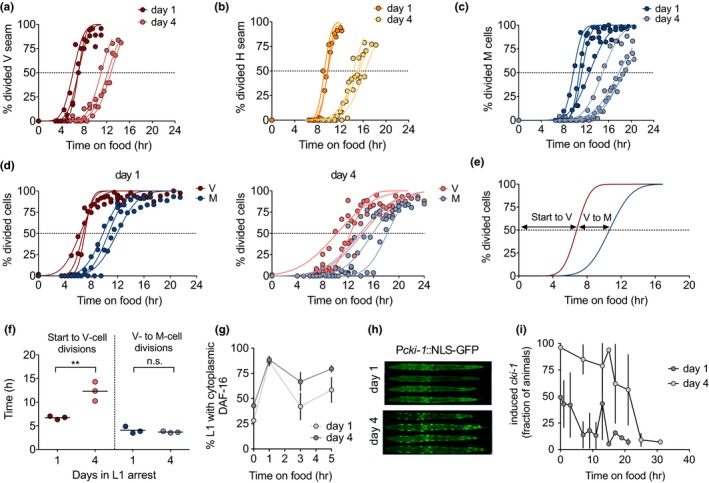
Figure 2.

Recovery time reflects reactivation of the developmental program. (a–c) Timing of seam cells (a,b) and M cell (c) division upon addition of food to L1 larvae arrested for one day or for four days. The plots show data from 3–4 biological replicates, and values represent the percentage of animals showing division. Curves represent the fit assuming a cumulative Gaussian distribution. The dashed lines indicate the value of 50% of animals with divided cells. (d) Timing of division of V seam cells and M cells upon addition of food to L1 larvae arrested for one day or for four days. We analyzed a double reporter to assay both divisions in the same animals, performing three biological replicates. (e) Representative plot showing the calculated intervals between cell divisions. (f) Prolonged arrest delays the division of V seam cells but not the timing between V‐ and M‐cell divisions. (g) Percentage of animals with cytoplasmic localization of DAF‐16 in the first five hours upon the addition of food after one or four day of L1 arrest. The plot shows the mean (±SD) of four biological replicates. (h) Representative images of cki‐1 activation after one and four days of L1 arrest. (i) Activation of cki‐1 during recovery after one or four days of arrest. The plot shows the average (±SD) of three independent replicates
