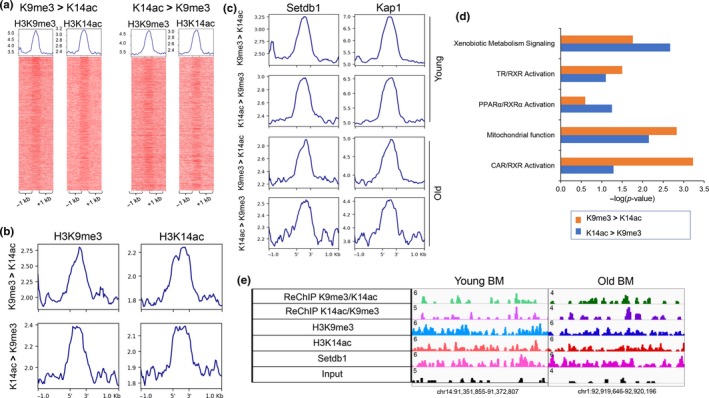
Figure 3.

K9me3/K14ac single H3 nucleosomes correlate with H3K9me3/H3K14ac dually marked bivalent genomic regions. (a) Heatmaps showing H3K9me3 (left) and H3K14ac (right) ChIP‐Seq signal at top 5,000 sequential ChIP regions in young livers (H3K9me3 > H3K14ac on the left, H3K14ac > H3K9me3 on the right). (b) Profile plots generates by deeptools showing H3K9me3 (left panel) and H3K14ac (right panel) signal at top 2,000 sequential ChIP regions in old livers (H3K9me3 > H3K14ac, top panel, H3K14ac > H3K9me3, bottom panel). Average number of reads per bin (25 bp) is shown on y‐axis. Reads from one biological replicate in each condition. (c) Profile plots generates by deeptools showing Setdb1 (left panel) and Kap1 (right panel) signal at top 5,000 sequential ChIP regions in young livers (H3K9me3 > H3K14ac, H3K14ac > H3K9me3, top two panels) and at top 2,000 sequential ChIP regions in old livers (H3K9me3 > H3K14ac, H3K14ac > H3K9me3, bottom two panels). Average number of reads per bin (25 bp) is shown on y‐axis. Reads from one biological replicate in each condition. (d) Ingenuity Pathway Analysis of genes that mapped to sequential ChIP regions in young livers (K9me3 > K14ac in orange, K13ac > K9me3 in blue) identified pathways, including activation of nuclear receptors CAR, TR, and PPAR‐dependent gene expression, similar to gene expression changes in old lives. (e) Examples of sequential ChIP regions with bulk H3K9me3 and H3K14ac signal and Setdb1 binding (chr14:91,351,855–91,372,807, left panel and chr1:92,919,646–92,920,196, right panel)
