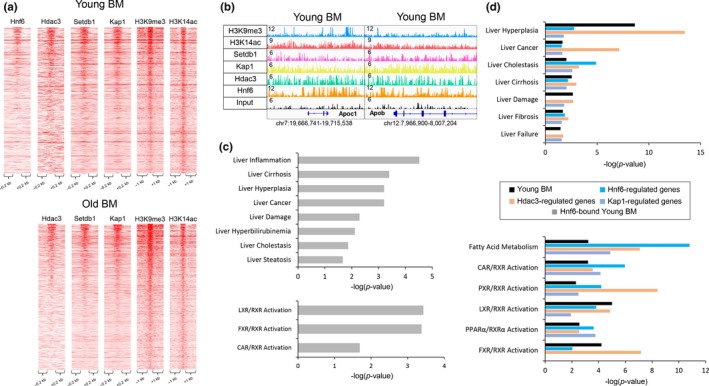
Figure 6.

Hdac3, Setdb1, and Kap1 co‐localize to same bivalent regions. (a) Heatmaps showing Hnf6, Hdac3, Setdb1, Kap1, H3K9me3, and H3K14ac ChIP‐Seq signal at regions with bivalent mark in young (left panel) and old livers (right panel). A subset of bivalent regions occupied by both Hdac3 and Setdb1/Kap1 complex is also bound by Hnf6 in young livers. (b) Examples of genomic regions showing the bivalent region bound by Hnf6, Hdac3, and Setdb1/Kap1 complex in young livers include regions near two apolipoprotein genes, Apoc1 (chr7:19,666,741–19,715,538), and Apob (chr12:7,976,007–7,982,176). Magnitude of the ChIP‐Seq signal is shown on y‐axis. (c) Ingenuity Pathway Analysis (IPA) of genes associated with Hnf6‐bound bivalent regions in young livers (Hnf6‐bound Young BM, gray bar) showing significantly overrepresented disease functions (top panel) and pathways (bottom panel). Inflammation, hyperplasia, and steatosis are among most significantly overrepresented hepatotoxicity functions (p‐values < 3.92E‐5, 6.24E‐4, 2.16E‐2, and LXR, FXR, and CAR activation pathways (‐log(p‐value) 3.34, 3.18) are most significantly overrepresented. (d) Comparison of overrepresented disease functions (top panel) and pathways (bottom panel) identified by Ingenuity Pathway Analysis (IPA) between young liver bivalent mark‐associated genes (Young BM, black bar) and genes regulated by Hnf6 (blue bar), Hdac3 (orange bar), and Kap1 (purple bar). Genes associated with bivalent regions are mapped by Genomic Regions Enrichment of Annotations Tool (GREAT). Expression data for Hnf6 (Zhang et al., 2016), Hdac3 (Sun et al., 2013), and Kap1‐regulated (Bojkowska et al., 2012) gene sets are published microarray studies. ChIP‐Seq data for Hnf6 are from a published study (Wang et al., 2014) and for H3K9me3 are from our previous study (Bochkis et al., 2014)
