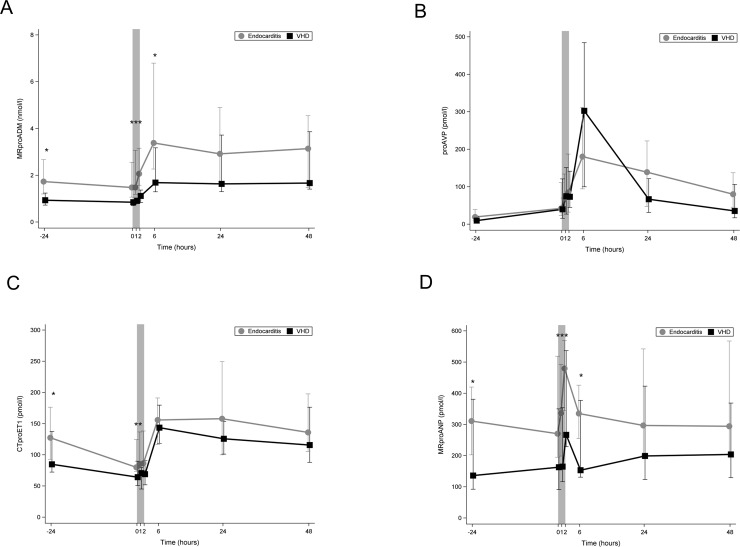
Fig 5.
Line chart comparing median plasma levels of biomarkers of cardiovascular dysfunction between the two study groups. (A) Line chart comparing median plasma levels of MR-proADM. (B) Line chart comparing median plasma levels of proAVP. (C) Line chart comparing median plasma levels of CT-proET-1. (D) Line chart comparing median plasma levels of MR-proANP. Bright line: IE patients; dark line: VHD patients; 0 on the x-axis represents the beginning of cardiopulmonary bypass (CPB); the shaded area represents the CPB time; *: p<0.05; IE: infective endocarditis; VHD: valvular heart disease; MR-proADM: midregional pro adrenomedullin; proAVP: copeptin pro vasopressin; CTproET-1: C-terminal pro endothelin; MR-proANP: midregional pro atrial natriuretic peptide.

