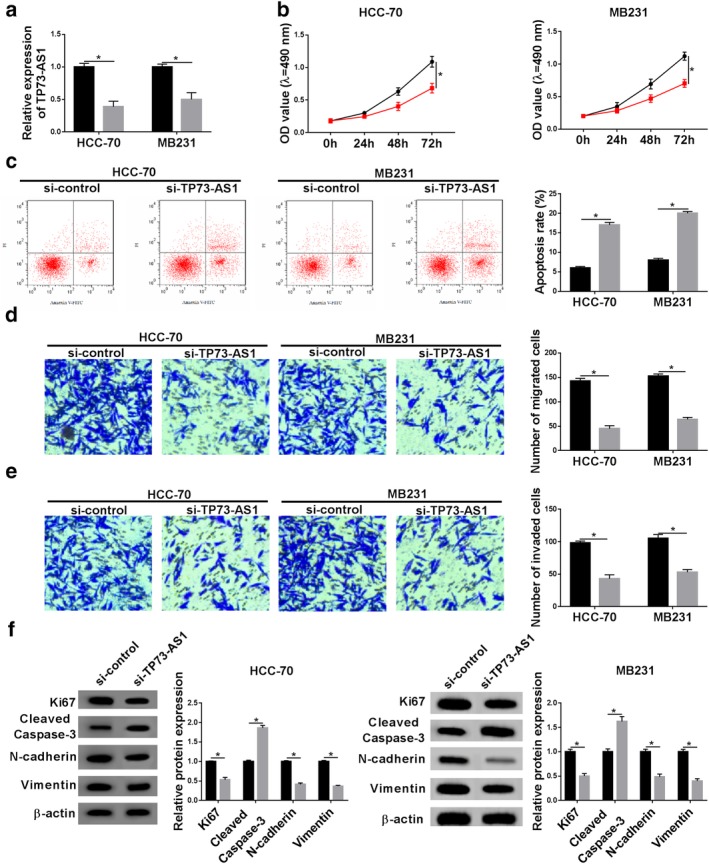
Figure 2.

The effect of TP73‐AS1 knockdown on the malignant progression of breast cancer cells in vitro. HCC‐70 and MB231 cells were transfected with siRNA against TP73‐AS1 (si‐TP73‐AS1) or its control (si‐control). (a) RT‐qPCR was used to analyze TP73‐AS1 level after transfection for 24 hours. (b, c) Cell counting kit 8 (CCK‐8) was utilized to determine cell proliferative capacity after transfection at 0 hour, 24 hours, 48 hours and 72 hours. (C) Flow cytometry was conducted to examine apoptosis rate after transfection at 24 hours. The percentage of apoptotic cells in quadrants of Annexin V+/PI− and Annexin V+/PI+ was statistically recorded. (d, e) Transwell assays were performed to evaluate cell migration and invasion abilities at 24 hours. The number of migrated cells and invaded cells was statistically recorded. (f) Western blotting was implemented to test protein expression of Ki67, cleaved caspase‐3, N‐cadherin and Vimentin after transfection at 24 hours. Protein bands of western blotting were quantified by densitometry and presented as fold changes with normalization to β‐actin. Data represent mean ± SEM and *P < 0.05. (a) ( ) si‐control and (
 ) si‐TP73‐AS1. (b) HCC (
 ) si‐control and (
 ) si‐TP73‐AS1. MB231 (
 ) si‐control and (
 ) si‐TP73‐AS1. (c–e) (
 ) si‐control and (
 ) si‐TP73‐AS1. (f) HCC‐70 (
 ) si‐control and (
 ) si‐TP73‐AS1. MB231 (
 ) si‐control and (
 ) si‐TP73‐AS1.
