Figure 3.

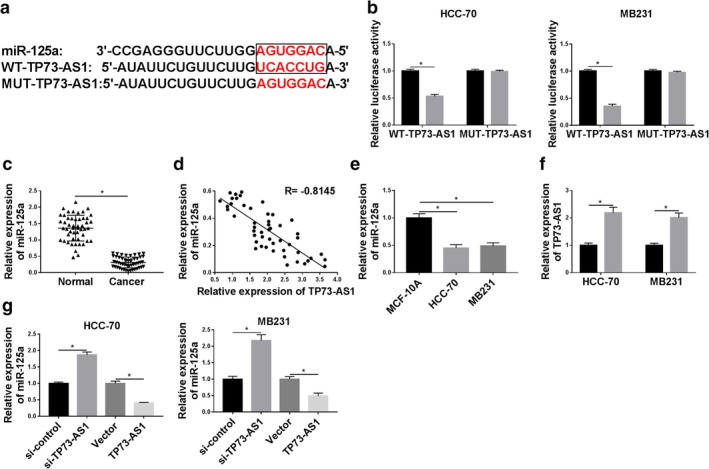
TP73‐AS1 regulated miRNA‐125a‐3p (miR‐125a) expression by targeting. (a) Prediction of binding sites between TP73‐AS1 and miR‐125a (in the box) were shown according to starbase Tools. The corresponding mutant of TP73‐AS1 (MUT‐TP73‐AS1) was presented as well. (b) Luciferase activity of wild‐type of TP73‐AS1 (WT‐TP73‐AS1) and MUT‐TP73‐AS1 was confirmed by dual luciferase reporter assay in HCC‐70 and MB231 cells when cotransfected with miR‐125a mimic (miR‐125a) or its control (miR‐control). HCC ( ) miR‐control and (
 ) miR‐125a. MB231 (
 ) miR‐control and (
 ) miR‐125a. (c) RT‐qPCR measured level of miR‐125a in breast cancer tissues (n = 45) compared with the paired normal tissues. (d) Spearman's rank correlation analysis clarified the association between miR‐125a and TP73‐AS1 expression in breast cancer tissues (n = 45). (e) RT‐qPCR measured miR‐125a level in breast cancer cell lines (HCC‐70 and MB231) comparing to the normal cell line MCF‐10A. (f) RT‐qPCR determined the transfection efficiency of pIRES2‐EGFP empty vector (vector) and recombinant vector containing TP73‐AS1 (TP73‐AS1) in HCC‐70 and MB231 cells. (
 ) Vector and (
 ) TP73‐AS1. (g) RT‐qPCR detected miR‐125a expression level in HCC‐70 and MB231 cells when transfected with si‐TP73‐AS1, si‐control, TP73‐AS1 and vector. Data represent mean ± SEM and *P < 0.05.
