Figure 6.

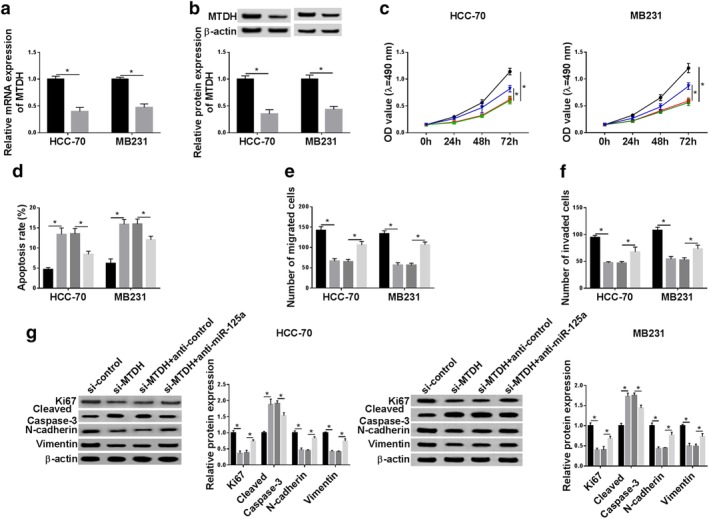
The impact of miR‐125a silencing on the role of MTDH downregulation in breast cancer cell malignancy in vitro. (a, b) RT‐qPCR and western blotting determined the transfection efficiency of siRNA against MTDH (si‐MTDH) and si‐control in HCC‐70 and MB231 cells. ( ) si‐control and (
 ) si‐MTDH. (c–g) HCC‐70 and MB231 cells were transfected with si‐control or si‐MTDH, and cotransfected with si‐MTDH and either anticontrol or anti‐miR‐125a. (c) CCK‐8 determined cell proliferative capacity after transfection at 0 hour, 24 hours, 48 hours and 72 hours. HCC‐70 (
 ) si‐control, (
 ) si‐MTDH, (
 ) si‐MTDH+anticontrol and (
 ) si‐MTDH+anti‐miR‐125a. MB231 (
 ) si‐control, (
 ) si‐MTDH, (
 ) si‐MTDH+anticontrol and (
 ) si‐MTDH+anti‐miR‐125a. (d) Flow cytometry examined apoptosis rate after transfection at 24 hours. (
 ) si‐control, (
 ) si‐MTDH, (
 ) si‐MTDH+anticontrol and (
 ) si‐MTDH+anti‐miR‐125a. (e, f) Transwell assays were performed to evaluate cell migration and invasion abilities at 24 hours. (
 ) si‐control, (
 ) si‐MTDH, (
 ) si‐MTDH+anticontrol and (
 ) si‐MTDH+anti‐miR‐125a. (g) Western blotting tested protein expression of Ki67, cleaved caspase‐3, N‐cadherin and Vimentin after transfection at 24 hours. HCC‐70 (
 ) si‐control, (
 ) si‐MTDH, (
 ) si‐MTDH+anticontrol and (
 ) si‐MTDH+anti‐miR‐125a. MB231 (
 ) si‐control, (
 ) si‐MTDH, (
 ) si‐MTDH+anticontrol and (
 ) si‐MTDH+anti‐miR‐125a. Data represent mean ± SEM and *P < 0.05.
