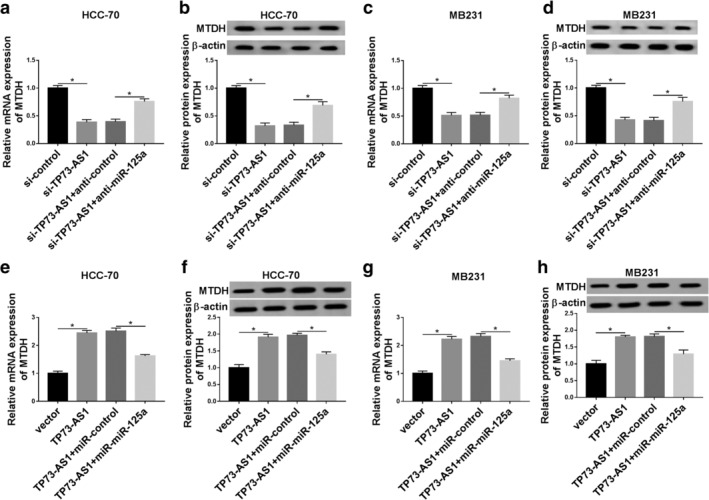
Figure 7.

MTDH expression was positively regulated by TP73‐AS1 through sponging miR‐125a. RT‐qPCR and western blotting determined MTDH expression levels in (a, b) HCC‐70 cells and (c, d) MB231 cells transfected with si‐TP73‐AS1 alone or together with anti‐miR‐125a or anticontrol. MTDH expression levels in (e, f) HCC‐70 cells and (g, h) MB231 cells transfected with TP73‐AS1 alone or combined with miR‐125a or miR‐control were also measured. Data represent mean ± SEM and *P < 0.05.
