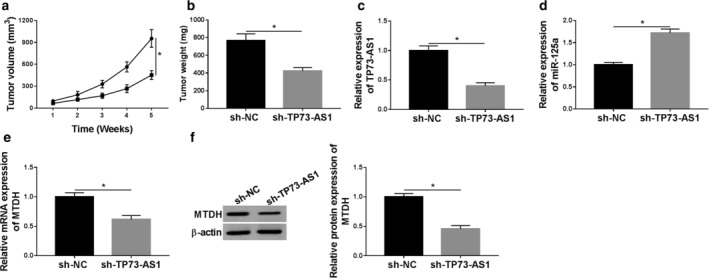
Figure 8.

Knockdown of TP73‐AS1 restrained tumor growth of breast cancer cells in vivo. HCC‐70 cells were stably expressed shRNA against TP73‐AS1 (sh‐H TP73‐AS1) or its negative control (sh‐NC), and were then subcutaneously injected into the right flanks of BALB/c nude mice (n = 6). (a) Tumor volume was measured every week after inoculation, and tumor growth curve was drawn. ( ) sh‐NC and (
 ) sh‐TP73‐AS1. (b) Tumor weight was recorded on the last week. (c–e) RT‐qPCR analysis testified the relative expression of TP73‐AS1, miR‐125a and MTDH in xenograft tumors. (f) Western blotting determined MTDH protein expression in randomly selected one xenograft tumor. Data represent mean ± SEM and *P < 0.05.
