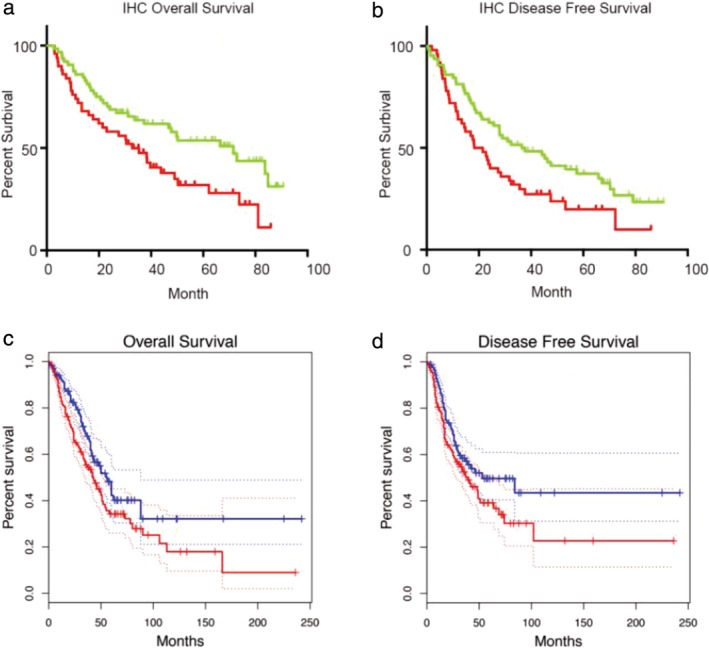
Figure 2.

Survival analysis of patients with high expression of OPN3 and low expression of OPN3 in LUAD. (a and b) Comparison of overall survival and disease‐free survival between the OPN3 high‐ and low‐expression group in 114 patients with LUAD by Kaplan‐Meier analysis ( ) low OPN3, and (
 ) high OPN3. (c and d) Differences in overall survival and disease‐free survival between OPN3 high‐ and low‐ expression group in TCGA data of patients with LUAD were detected by Kaplan‐Meier analysis (
 ) low OPN3 TPM, and (
 ) high OPN3 TPM. log‐rank test, P < 0.05.
