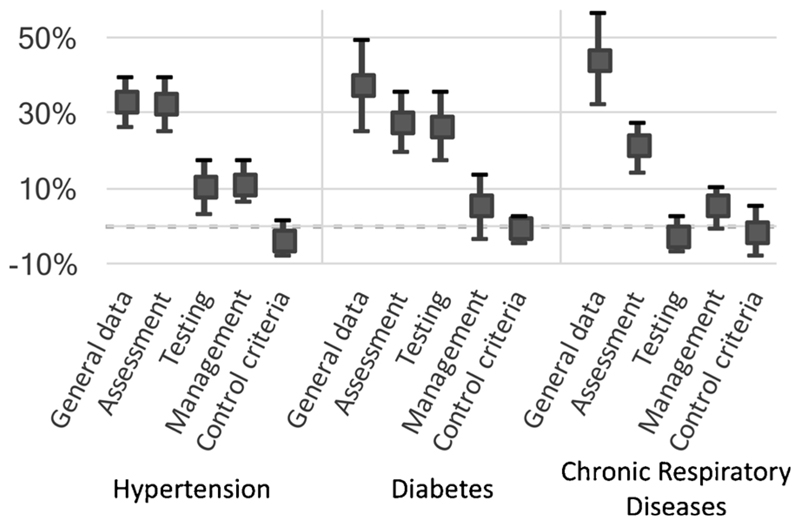
Fig. 2. Effect of the intervention on individual scoring criteria.
The filled squares represent the mean difference in documentation scores between pre- and post-intervention periods. Error bars represent 95% confidence intervals. Dimensions of ‘Scoring’ criteria are shown individually, highlighting the variable effect of the intervention on different aspects of clinical documentation.

