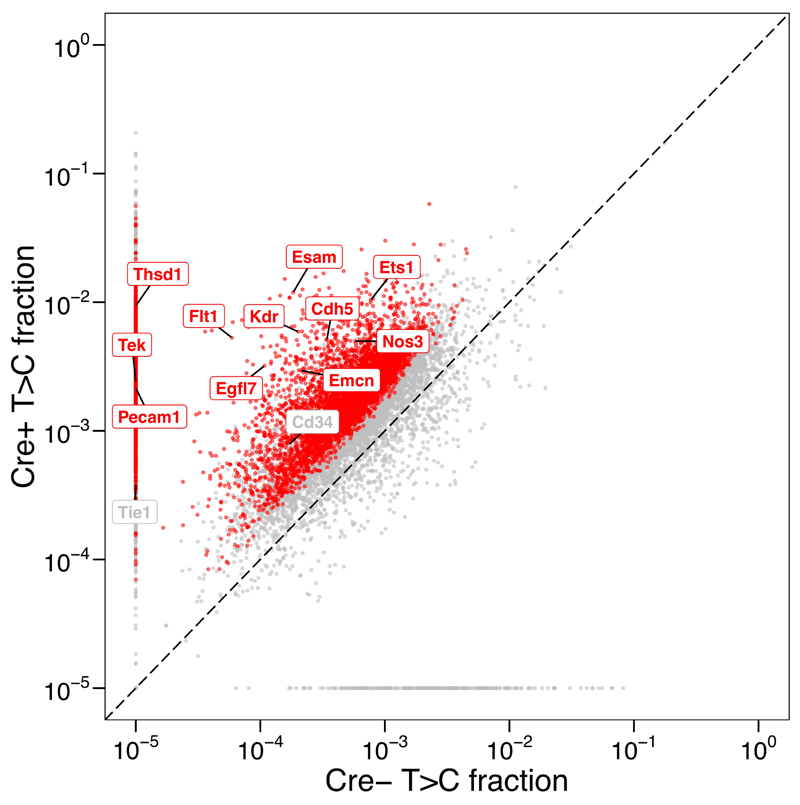
Figure 3. Typical T>C fraction results in Cre+ and Cre- mice.
Each point represents T>C fraction of a single gene in two mouse genotypes, Cre+ and Cre-. Red points represent genes significantly more labelled in Cre+ compared to Cre- (FDR < 0.05, beta-binomial test). Known endothelium-specific genes are labelled with their gene names. This plot is adopted from Matsushima et al12. This animal experiment was conducted in accordance with UK Home Office regulations, UK Animals (Scientific Procedures) Act of 1986 under a UK Home Office license that approved this work (PF8733E07), which was reviewed regularly by the Wellcome Sanger Institute Animal Welfare and Ethical Review Body.

