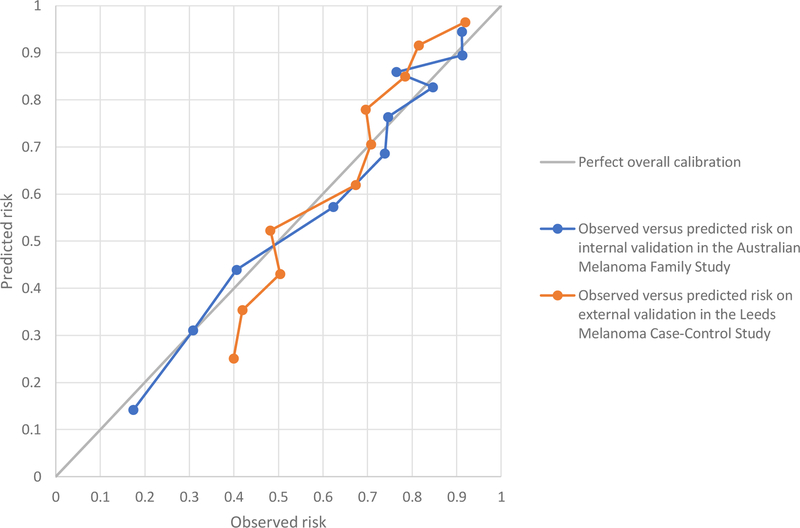
Figure 1. Calibration plot showing the observed versus the model’s predicted risk of incident melanomas across on internal and external validation.
This graph compares the observed and the model’s predicted risk of incident melanomas on internal validation in the Australian Melanoma Family Study (blue line) and on external validation in the Leeds Melanoma Case-Control Study (orange line), with perfect overall calibration (black line).

