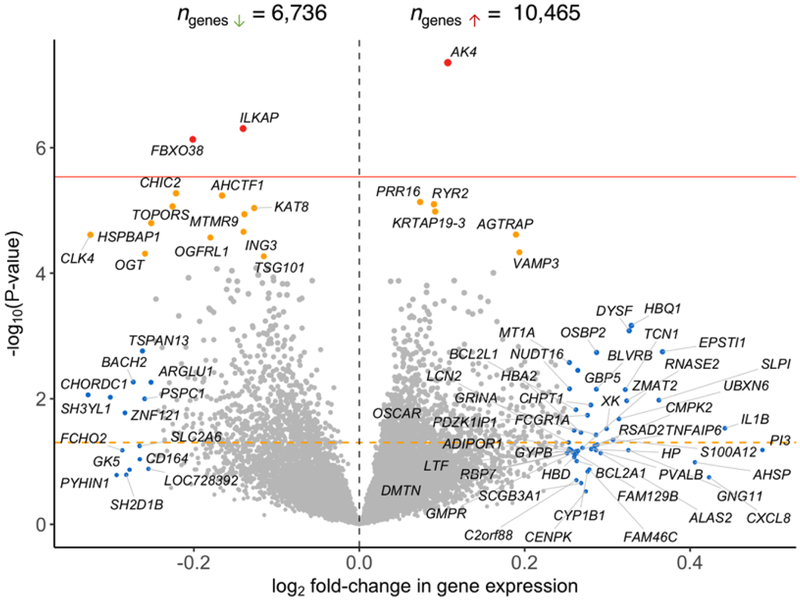
Figure 1.
Volcano plot showing the log2 fold-change in gene expression between bipolar disorder (BD) cases and unaffected comparison subjects (horizontal axis) relative to p-value for the fold-change estimate (vertical axis). An orange horizontal dotted line denotes p = 0.05. A red dotted horizontal line denotes a Bonferroni significance threshold (adjusted p = 0.05/17201 = 2.91e–06). Genes shaded red showed an association with BD at a Bonferroni adjusted p < 0.05. Genes shaded in orange showed an association with BD at a Benjamini-Hochberg false discovery rate (FDR) p < 0.05. Genes shaded blue showed an absolute log2 fold-change > 0.25 in BD cases.

