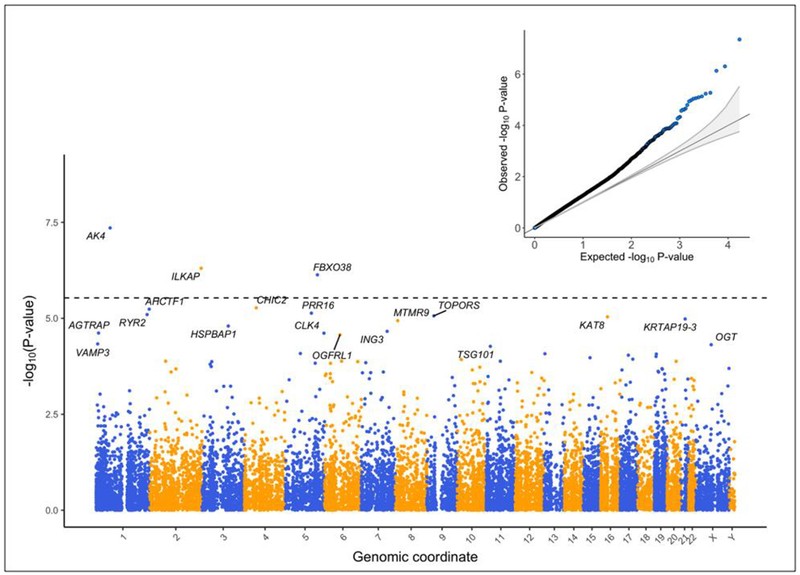
Figure 2.
The association significance (vertical axis) and physical location of each gene (horizontal axis) is depicted in this Manhattan plot. A horizontal dotted line denotes a Bonferroni adjusted significance threshold. The genes labeled in this plot reached a statistical significance in association with BD at a Benjamini-Hochberg false discovery rate adjusted p-value < 0.05. A quantile-quantile (QQ) plot in the inset shows the expected distribution of p-values under the null hypothesis of no association versus the p-values observed from our meta-analysis.

