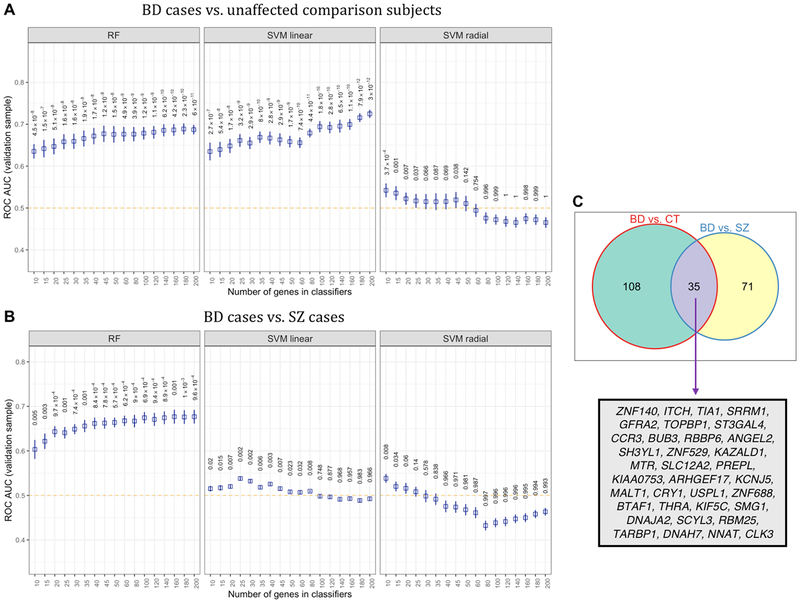
Figure 5.
Classification performance of three machine learning (ML) algorithms that were trained on peripheral blood gene expression profiles to distinguish bipolar disorder (BD) from unaffected comparison subjects, and BD cases from schizophrenia (SZ) cases. (A) Average ROC AUCs found in with-held test samples for random forests (RF), linear-kernel support vector machines (SVM), and radial-kernel SVM based on the classification of BD cases and unaffected comparison subjects. P-values for ROC AUCs were computed using a one-tailed t-test with a population mean of 0.5 (i.e., chance accuracy, designated by orange dotted line) (B) The performance of three ML models in classifying BD cases and SZ cases in test samples that were completely with-held from sample of BD and SZ cases used to train the ML classifiers. (C) A Venn diagram shows the number of genes used for classification in two or more bootstraps.

