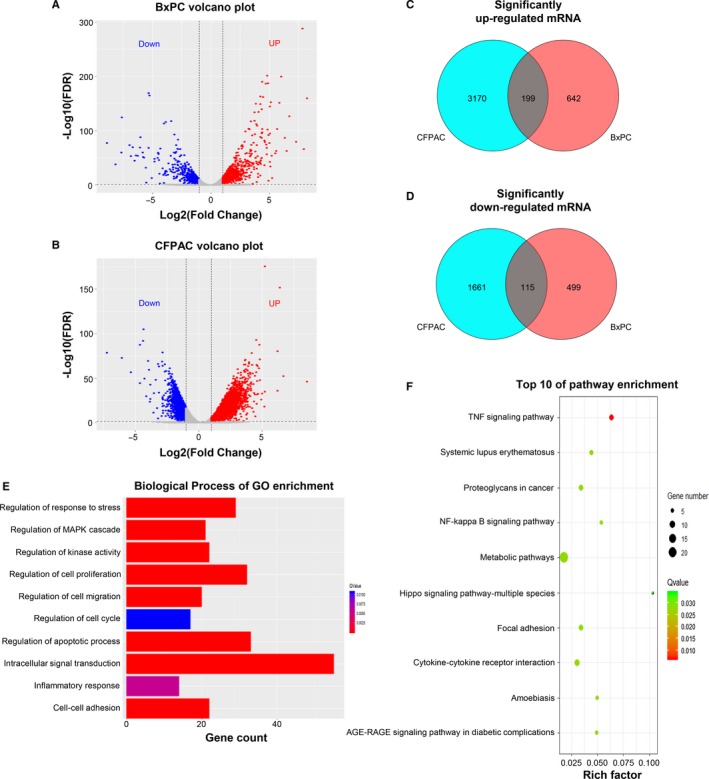
Figure 5.

Overview of mRNA expression and enrichment analyses between gemcitabine (GEM)‐resistant and parental cell lines. A and B, Volcano figure showing significantly differentially expressed (SDE) genes in BxPC‐3‐GR and CFPAC‐1‐GR cells compared to their respective parental cells. Red and blue dots indicate significantly up‐ and downregulated genes in GEM‐resistant cells, respectively. C and D, Venn diagrams show consistently up‐ and downregulated mRNAs in the GEM‐resistant cell lines. E, Biological processes identified by gene ontology (GO) enrichment analysis based on consistent SDE genes. F, Top 10 results of Kyoto Encyclopedia of Genes and Genomes pathway enrichment analysis based on consistent SDE genes. FDR, false discovery rate
