
Figure 1.
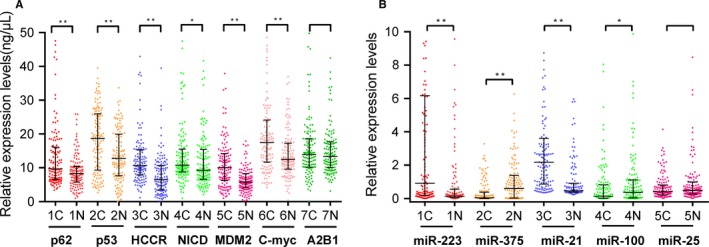
The expression levels of TAAbs and miRNAs in esophageal squamous cell carcinoma (ESCC) patients and healthy controls. a scatter plots of the expression levels of autoantibodies in 125 ESCC patients and 125 healthy controls, b scatter plots of the expression levels of miRNAs in 125 ESCC patients and 125 healthy controls. Line, median with interquartile range; C, cancer; H, healthy. *P < .05, **P < .01(Mann‐Whitney U test)