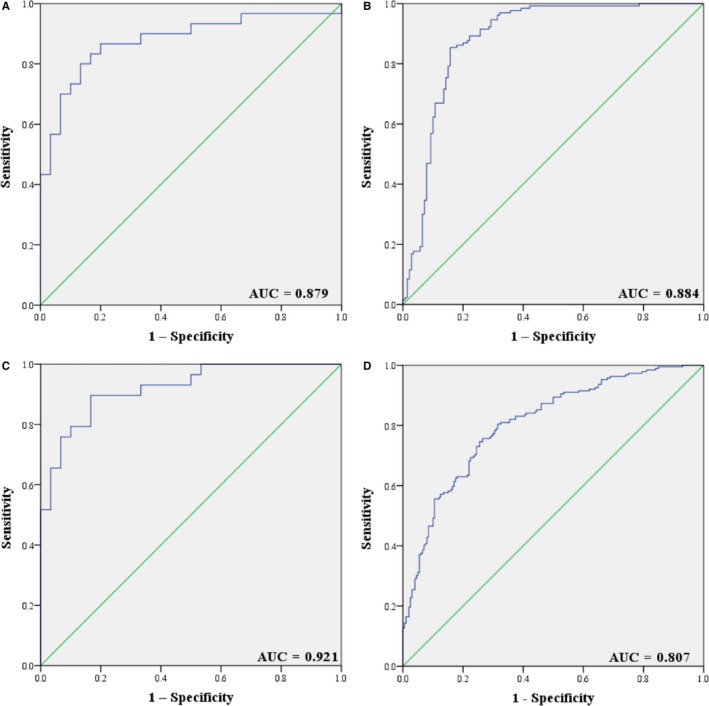
Figure 4.

Receiver operating characteristic (ROC) curve analysis of the seven‐miRNA panel for NPC detection. A, training stage (30 NPC vs 30 NCs); (B) testing stage (140 NPC vs 130 NCs); (C) external validation stage (30 NPC vs 29 NCs); (D) combined three stages (200 NPC vs 189 NCs) (ROC curve: receiver‐operating characteristic curve; AUC: area under the ROC curve.)
