
Figure 3.
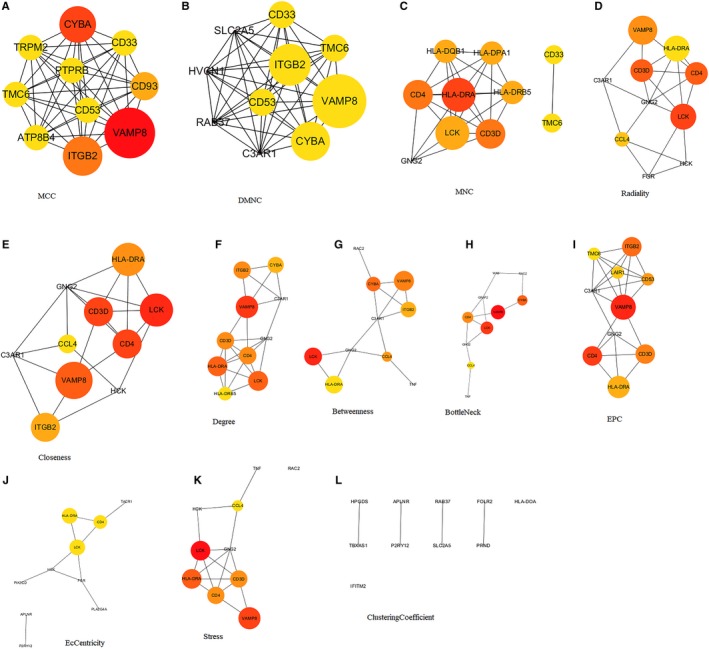
Hub genes screened by 12 algorithms from cytoHubba. The network shown the analysis results generated by the algorithms of MCC (A), DMNC (B), MNC (C), Radiality (D), Closeness (E), Degree (F), Betweenness (G), BottleNeck (H), EPC (I), EcCentricity (J), Stress (K) and ClusteringCoefficent (L). The size of the circle indicates the node degree