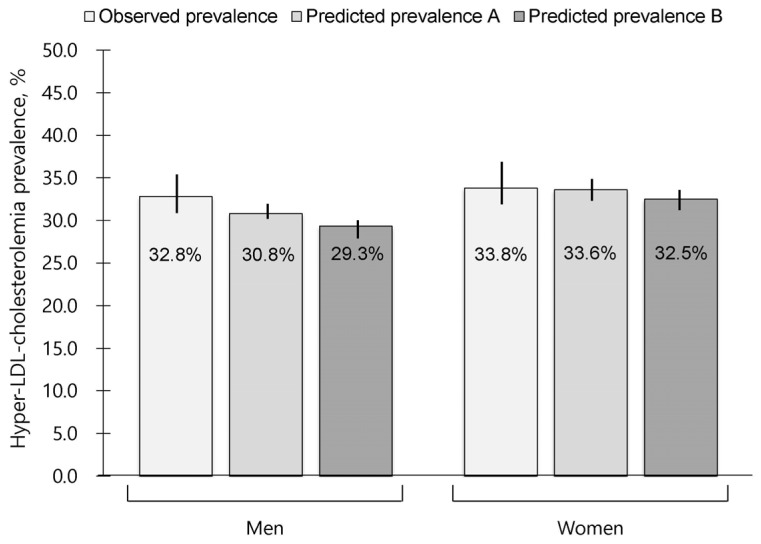
Fig. 1. Observed and predicted estimates of hyper-LDL-cholesterolemia prevalence calculated using the 2016 Korea National Health and Nutrition Examination Survey data.
The ‘predicted prevalence A’ indicates an estimate calculated using the final models presented in Table 3. The ‘predicted prevalence B’ indicates an estimate obtained when considering a 2 kg/m2 reduction in the body mass index of obese persons in the given models. The vertical line on the bar indicates the 95% confidence interval. Logistic regression analysis was used.

