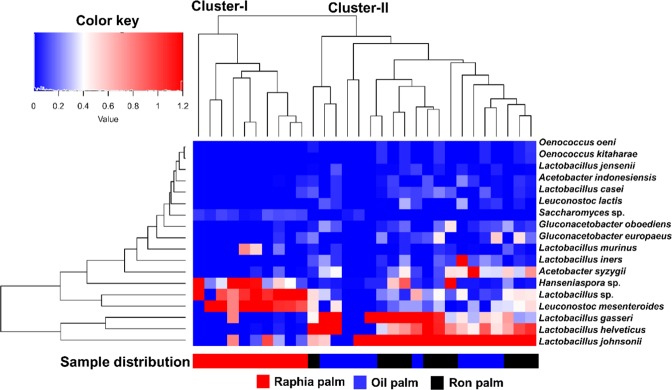
Figure 4.
A hierarchically clustered heat map shows the microbial species-level differential abundance in three palm wine types. The significantly differencing 18 bacterial and yeast species (q < 0.0001, Wilcoxon test, BH corrected) between the wine types are clustered here. The abundance difference is shown as a color key with a red and blue colour gradient. The sample distribution of different types of wines over the clusters (Clusters I and II) is shown below the heat map.

