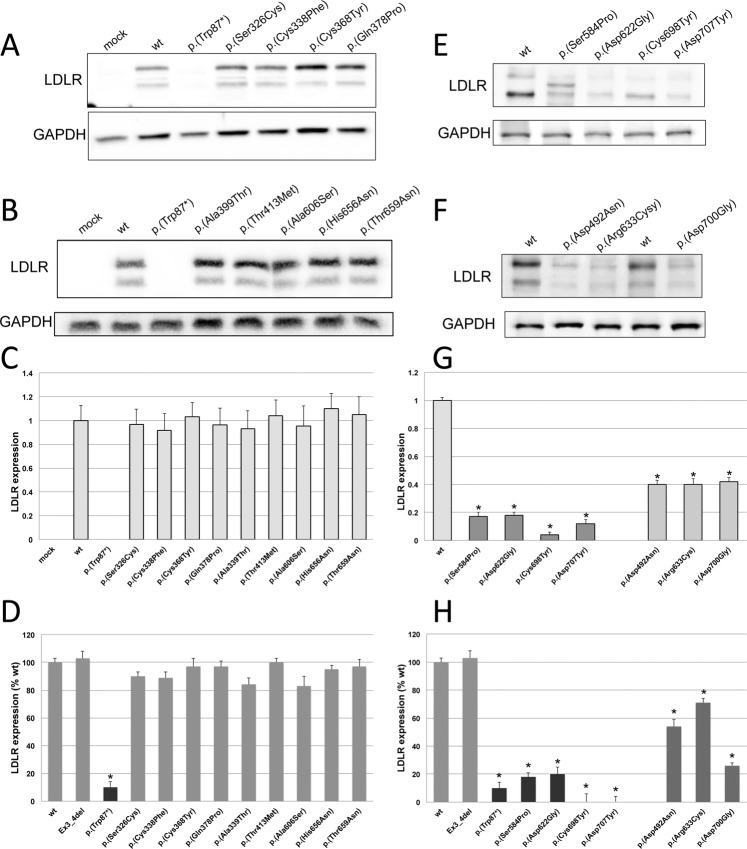
Figure 2.
Expression of wt and sixteen LDLR variants in CHO-ldlA7 transfected cells. Expression of LDLR was determined 48 h post-transfection with the plasmids carrying the different LDLR variants by Western blot and flow cytometry. (A,B,E,F) Western blot analysis of LDLR expression. (C,G) Quantification of the intensities of the bands obtained by Western blot by densitometry and, (D,H) LDLR expression determined by flow cytometry. A representative blot is shown in panel A,B,E and F. C and G represent the mean of band quantification of three independent Western blots. The values in D and H represent the mean of triplicate determinations (n = 3); error bars represent ± SD. *P < 0.001 compared to wt using a Student’s t-test.

