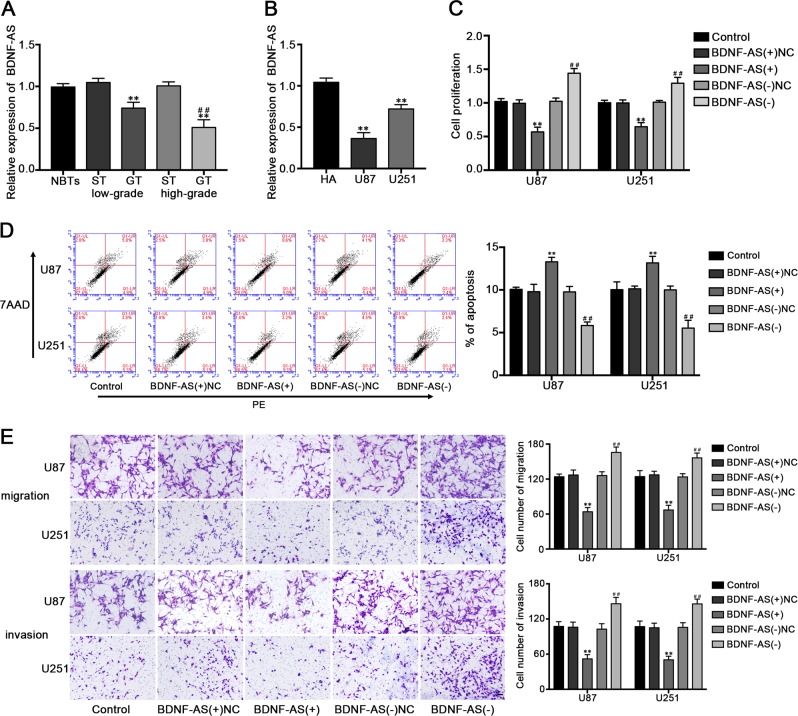
Fig. 2. The expression and effects of BDNF-AS in glioblastoma cells.
a The relative expression levels of BDNF-AS in NBTs, low and high grades of human glioma tissues. Data are presented as the mean ± SD (n = 4, each group). **P < 0.01 vs. ST group; ##P < 0.01 vs. low-grade GT group. b The relative expression levels of BDNF-AS in HA and glioblastoma cell lines. Data are presented as the mean ± SD (n = 3, each group). **P < 0.01 vs. HA group. c Effect of BDNF-AS on the cell proliferation, cell apoptosis (d), cell migration and invasion (e) of glioblastoma cells. Scale bars represent 40 μm. (n = 5, each group). **P < 0.01 vs. BDNF-AS(+)NC group; ##P < 0.01 vs. BDNF-AS(−)NC group.

