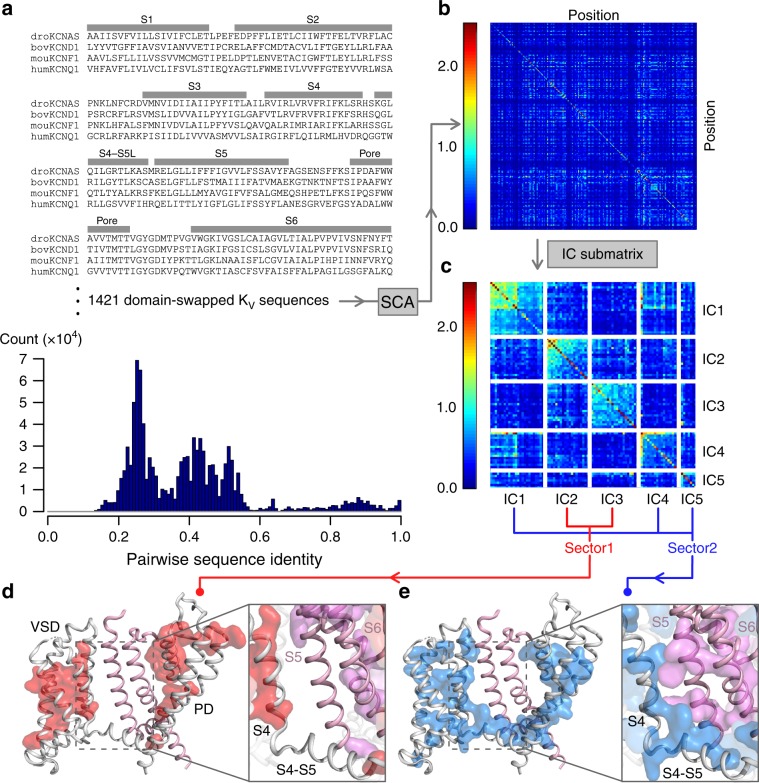
Fig. 6. Statistical coupling analysis suggest conservation of the two-stage E–M coupling across domain-swapped KV superfamily.
a Sample multiple sequence alignment (MSA) containing domain-swapped KV channels (KV1-KV9) used as input for statistical coupling analysis (SCA). The bottom histogram shows counts for pairwise sequence identity between all pairs of residues within the MSA. MSA uses the nomenclature established by the HUGO Gene Nomenclature Committee (HGNC) for voltage-gated potassium channels80. b SCA covariance matrix calculated by SCA (see Methods). X and Y axes indicate amino acid positions, while colors indicate the degree of covariance, with blue and red corresponding to lowest and highest degrees of covariation. c The independent component (IC) submatrix visualizes a subset of the SCA matrix (panel b) in which the residues are the highest covariant. Each IC represents a group of co-varying/co-evolving amino acids as calculated by SCA (see Methods). Axes are amino acid position numbers. Diagonal boxes indicate covariation within each IC, off-diagonal boxes indicate cross talk between ICs. Sector 1 and sector 2 were defined by combining the IC as shown (also see Methods and Supplementary Fig. 7). d–e Mapping sectors 1 and 2, as calculated by SCA, on the KV7.1 cryoEM structure. The main subunit is colored gray, the neighboring subunit is colored pink. Sectors 1 (d) and 2 (e) on the main subunit are colored red and blue. Insets show S4, S4-S5L of the main subunit and S5, S6 of the neighboring subunit. The respective sectors on the neighboring subunit are colored magenta in the inset. All other elements in the insets are transparent for the clarity. Source data for SCA are provided as a Source Data file.

