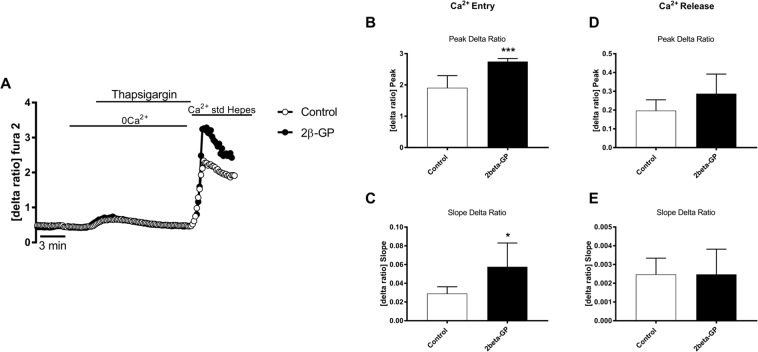
Figure 2.
ß-glycerophosphate-sensitive intracellular Ca2+ release and store-operated Ca2+ entry (SOCE) in Meg01 cells. (A). Representative tracings of Fura-2 fluorescence-ratio in fluorescence spectrometry before and following extracellular Ca2+ removal and addition of thapsigargin (1 µM), as well as re-addition of extracellular Ca2+ in Meg01 cells without (control, white circles) or with (black circles) prior exposure to 2 mM ß-glycerophosphate for 24 hours. (B,C). Arithmetic means (±SEM, n = 56–52 cells from 7 groups) of peak (B) and slope (C) increase of fura-2-fluorescence-ratio following addition of thapsigargin (1 µM) in Meg01 cells without (control, white bars) or with (black bars) prior exposure to 2 mM ß-glycerophosphate for 24 hours. (D,E). Arithmetic means (±SEM, n = 56–52 cells from 7 groups) of peak (D) and slope (E) increase of fura-2-fluorescence-ratio following re-addition of extracellular Ca2+ in Meg01cells without (control, white bars) or with (black bars) prior exposure to 2 mM ß-glycerophosphate for 24 hours. *(p < 0.05), ***(p < 0.0005) indicates statistically significant difference to respective value without prior ß-glycerophosphate treatment (Student’s t- test).

