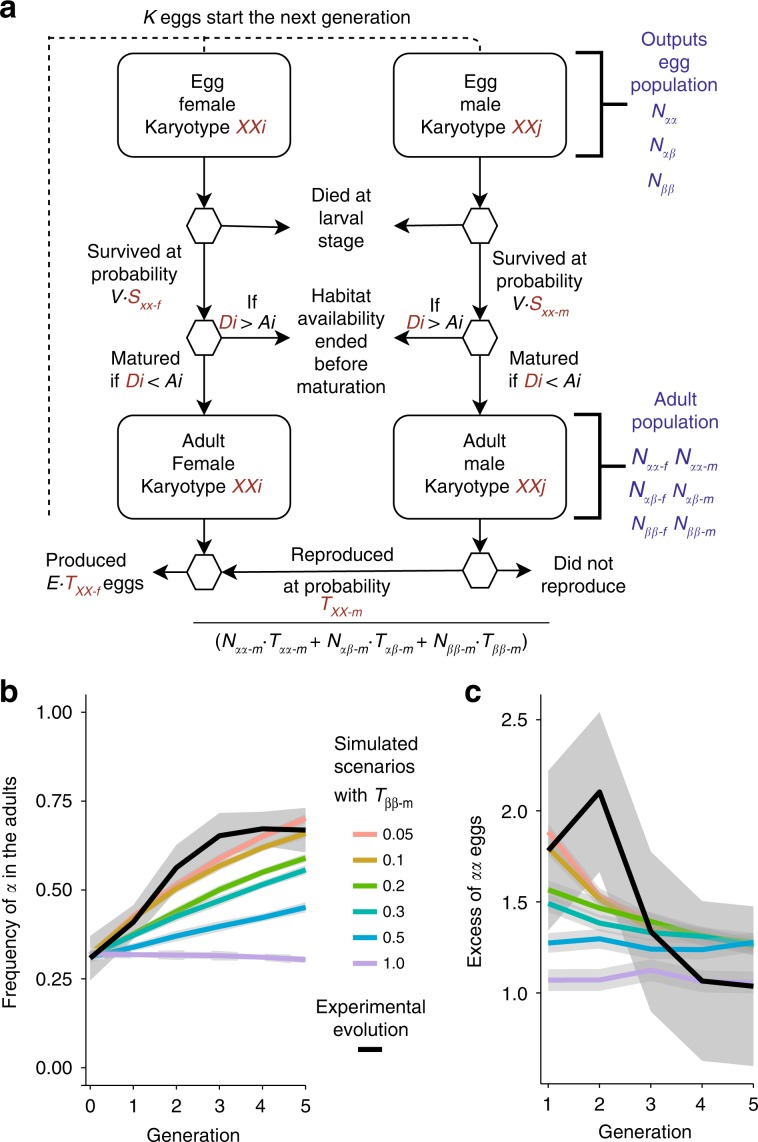
Fig. 3. In silico evolution of Coelopa frigida and inversion dynamics over five generations.
a Overview of the individual-based simulation model. Each egg is characterized by a genotype and a sex, inherited in a Mendelian fashion from its parents. Eggs survive through the larval stage at a probability determined by the product of V (global viability = 0.3) and SXX-s, the relative survival rate for each combination of sex and genotype (Table 1). The larva transitions into an adult only if its development time, an individual value (Di) drawn from a distribution determined by its genotype and sex, is shorter than its individual value of habitat availability (Ai), drawn from a uniform distribution of habitat availability characterized by two parameters, mean duration (Amean) and variability (Avar). For scenarios simulating laboratory experimental conditions, Amean is set to a very large value (30 days). Adults go through a reproduction phase during which all females mate and lay a number of eggs determined by the product of the fertility parameter E (70 eggs) and TXX-f, the relative female reproductive success by genotype drawn from experimental estimate (Table 1). Male can reproduce several times. For each female, a random male is drawn from the pool of adult males at a probability TXX-m, the relative male reproductive success, determined by their genotype (Table 1), and based on the relative proportions of males in the population. The next generation starts with a subset of K eggs representing either the experimental procedure or a limited carrying capacity in nature. b, c Comparison of the evolution of α frequency and αα excess in the eggs over five generations in the experiment to simulated scenarios of in silico evolution based on experimental parameters. Data are smoothed using a loess method across four replicates per generation for experimental data and across 30 replicates per generation and per set of parameters for simulated data, and standard error of the mean bounds are represented by the grey shade. Source data are provided as a Source Data file.

