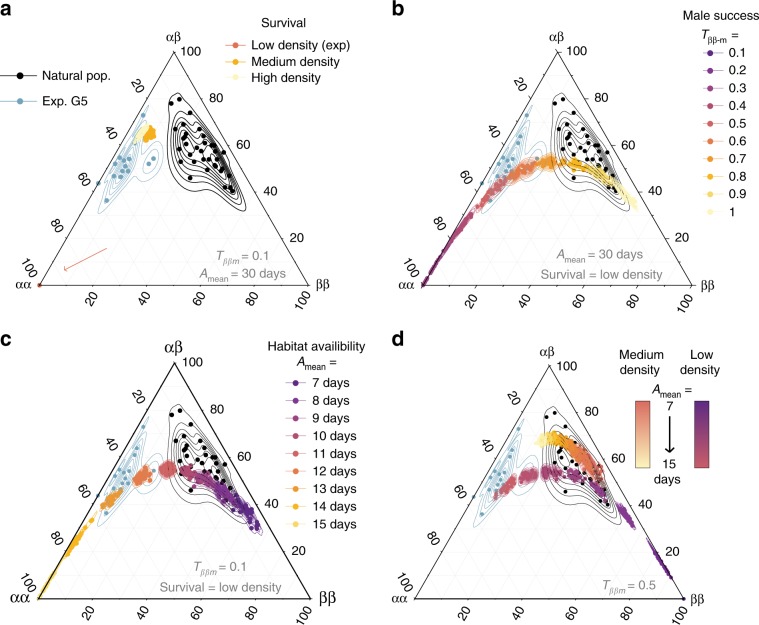
Fig. 4. Inversion genotype proportions under simulated scenarios of in silico evolution.
Ternary plots comparing the proportions of the three genotypes in natural populations26, 27, after the 5th generation of our laboratory experiment and at the equilibrium after 200 generations of simulations exploring the parameter space representative of the conditions encountered by Coelopa frigida in the wild. Simulated scenario vary a the effect of density, and the related relative survival rate, b the range of values for male relative reproductive success (Tαα-m = 1, Tαβ-m = 1/2(Tαα-m + Tββ-m), Tββ-m = [0.1–1.0]), c the effect of a limited duration of the habitat availability (Amean = [7–15 days], Avar = 2 days), and d the combined effects of density and environment for moderate differences of male relative reproductive success (ββ male reproductive success Tββ-m = 0.5, i.e. two-fold lower than αα male reproductive success). Each point is either the proportion of genotypes for one natural population, one experimental replicate at G5 or the outcome of a single simulation. Lines draw a kernel density estimate for each group (natural populations, generation 5 of the experiment or each set of parameters). Source data are provided as a Source Data file.

