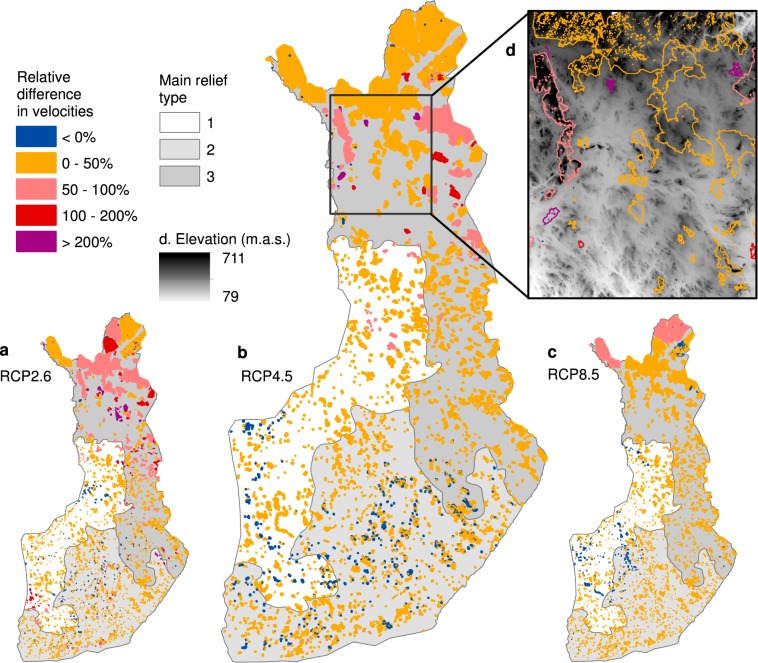
Figure 3.
Relative difference between 50-m resolution and 1-km resolution GDD velocity values in the protected areas (PAs) included in the Natura 2000 network (n = 5,068). The results are shown for three relief regions (1 = flatlands; 2 = gently undulating hilly terrain; 3 = rugged terrain) and three climate scenarios; (a) RCP2.6; (b) RCP4.5; (c) RCP8.5. Relative differences in velocities larger than zero indicate PAs where 1-km resolution velocities are larger than 50-m resolution velocities, and values which are smaller than zero indicate PAs where the 50-m resolution velocities are larger than 1-km resolution velocities. (d) Shows a zoomed-in example area in topographically heterogeneous, rugged terrain in North Finland.

