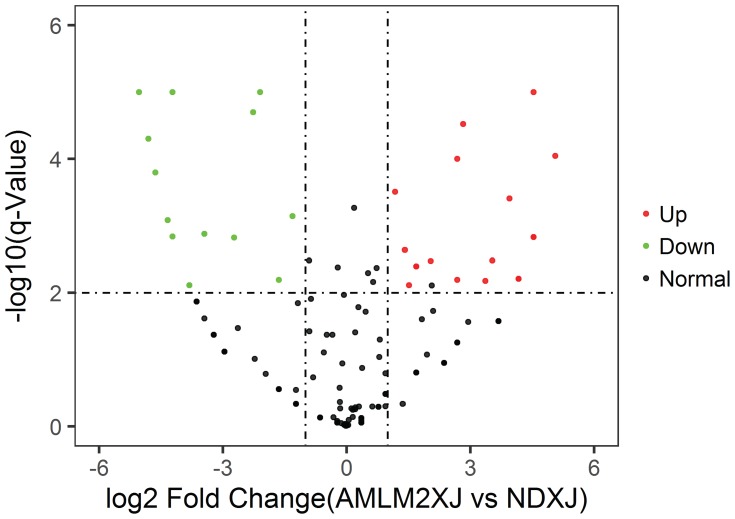
Figure 6.
Volcano plot: Plasma samples from AML patients vs normal donors.
Notes: Log2 Fold Change is shown on the x-axis and–log10 p-value is shown on the y-axis. Points in bold font indicate miRNAs with statistically significant log fold change and adjusted p-value, green color indicated down-regulation and red color indicated up-regulation.

