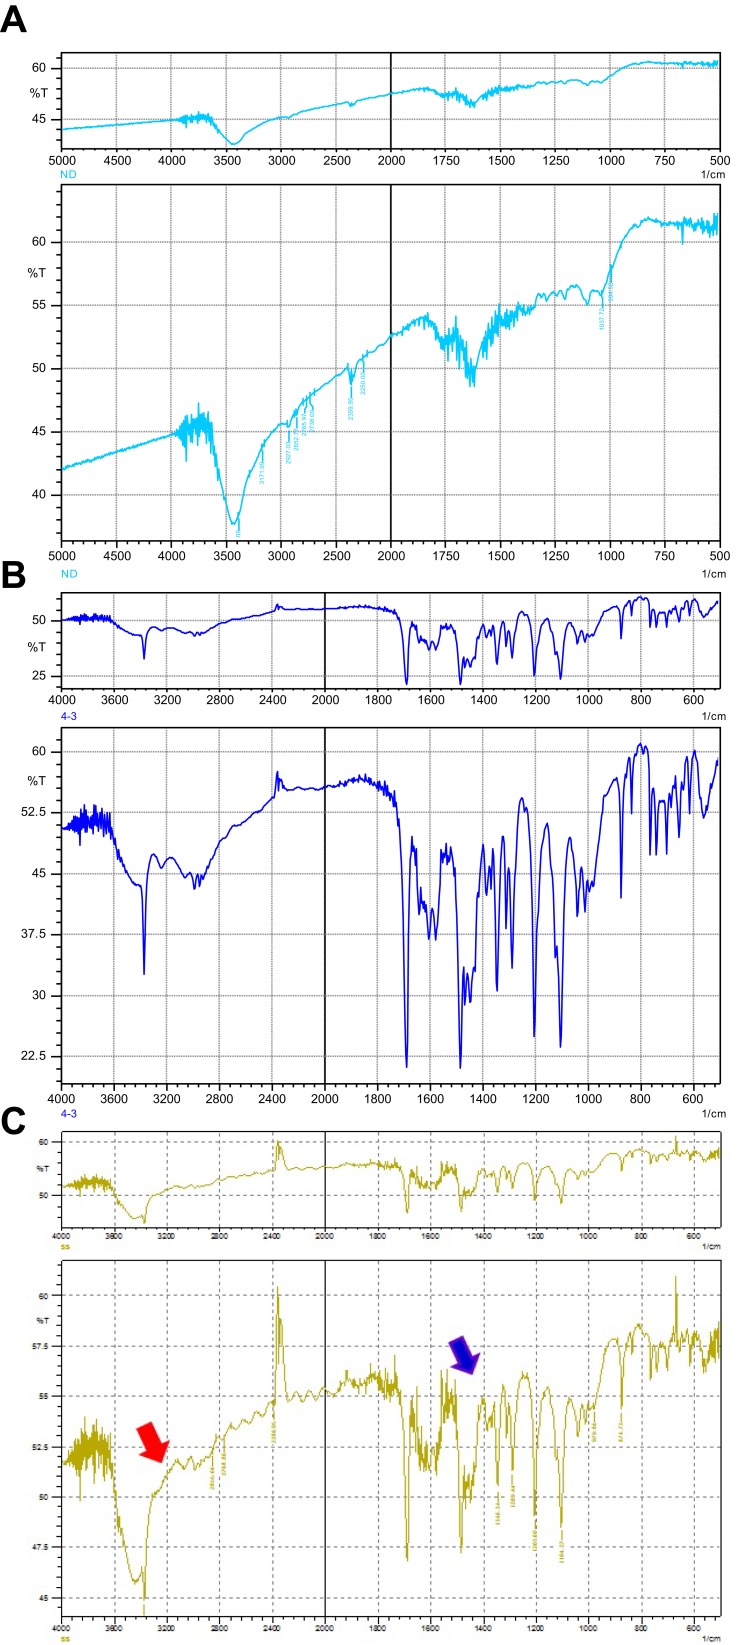
Figure 2.
FTIR spectra depicting the characteristic peaks of the functional groups on nanodiamond particles and amlodipine: (A) FTIR spectra of nanodiamond particles; (B) FTIR spectra of amlodipine; (C) FTIR spectra of nanodiamond–amlodipine conjugates (strong peaks of amlodipine overlapped with nanodiamond particles spectra). Red arrow denotes to the FTIR peaks of nanodiamond particles; blue arrow denotes to the FTIR peaks of amlodipine.

