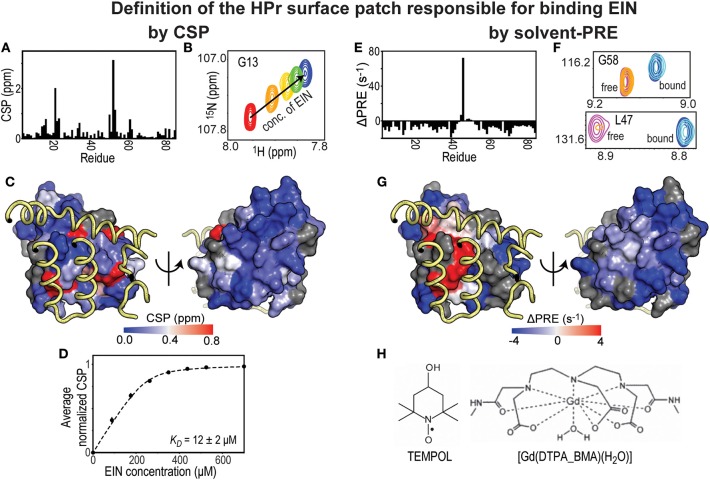
Figure 1.
Solvent-PRE and CSP analysis of EIN-HPr complex. (A) CSP measured for 15N-labeled HPr in the presence of saturating concentrations of unlabeled EIN are plotted vs. residue index. (B) Example cross-peak from 1H-15N HSQC spectrum of 15N-labeled HPr measured at increasing concentration of EIN. A peak from the complex interface was selected. (C) The CSP data from panel (A) are plotted on the surface of HPr according to the color bar. The relevant portions of EIN are shown as yellow tubes. (D) CSP vs. concertation of EIN (black circles). The data can be fit (black line) to return the KD of the EIN-HPr complex. (E) ΔPRE vs. residue index. ΔPREs are calculated by subtracting the solvent-PREs (i.e., the increase in 1HN-R2 caused by addition of 4 mM Gd(DTPA-BMA) to the NMR sample) measured for 15N-labeled HPr complexed to unlabeled EIN from the solvent-PRE data measured for the free protein. While the majority of the HPr residues show a negative ΔPRE (which is the result of the reduced rotational diffusion of complexed HPr compared to the free protein), obstruction of the paramagnetic probe from the binding interface results in positive ΔPREs. (F) Example cross-peaks from 1H-15N HSQC spectra of 0.8 mM 15N-labeled HPr in the presence of 0 mM EIN and 0 mM Gd(DTPA-BMA) (pink), 0 mM EIN and 4 mM Gd(DTPA-BMA) (orange), 1 mM EIN and 0 mM Gd(DTPA-BMA) (blue), 1 mM EIN and 4 mM Gd(DTPA-BMA) (cyan). The two cross-peaks have been chosen to illustrate the cases of a residue located far from the complex interface (G58) and of an HPr residue that is in direct contact with EIN (L47). (G) ΔPREs are plotted on the surface of HPr according to the color bar. The relevant portions of EIN are shown as yellow tubes. (H) Structures of two commonly used paramagnetic probes for surface accessibility studies.

