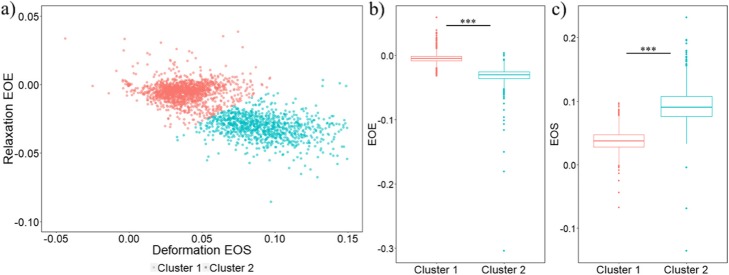
Fig. 2.
Two clusters of MDA-MB-231 cells are observed. a Scatterplot of Relaxation EOE vs Deformation EOS for MDA-MB-231 cells. The two subgroups are identified with the k-means clustering algorithm and labeled by different colors (red: cluster 1, blue: cluster 2). Negative EOS values in the plot can have two causes: first, strongly rotating cells that influence the shape detection; second, active contractions under force activation (data not shown). Similarly, a positive EOE values can indicate a strongly rotating cells or continued deformation during the relaxation phase. b Boxplot comparing relaxation at the end of experiment between cluster 1 and cluster 2 of MDA-MB-231 cells (p value < 0.001). c Boxplot comparing deformation at the end of stretch between the two subgroups of MDA-MB-231 cells (p value < 0.001)

