Fig. 4.
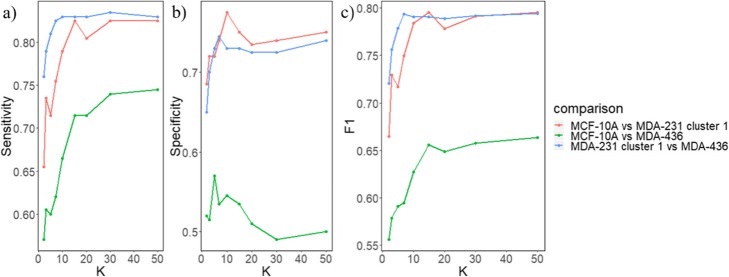
Pairwise k-NN classification results show that MDA-MB-231 and MDA-MB-436 cells are more different from each other than from MCF-10A cells. a Sensitivity (true positive rate) for the three comparisons versus different values of k. b Specificity (true negative rate) for the three comparisons versus different values of k. c F1 score for the three comparisons versus different values of k

