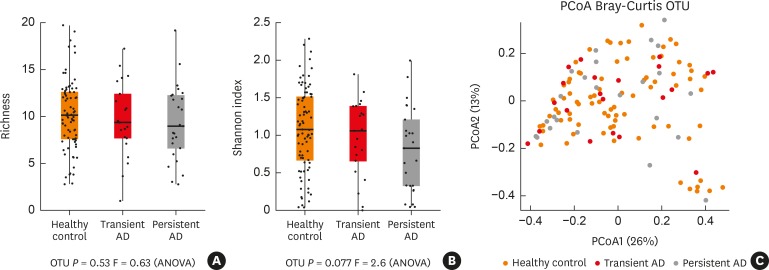
Fig. 1. Bacterial alpha and beta-diversity within the gut microbiota of the infant subjects. (A, B) Dotplots of richness (OTUs) and Shannon index of alpha diversity in the gut microbiota were compared among the study groups. (C) The beta-diversity of microbiota was compared using the PCoA plot based on unweighted UniFrac distances.
OTU, operational taxonomic unit; PCoA, principal coordinates analysis; ANOVA, analysis of variance; AD, atopic dermatitis.

