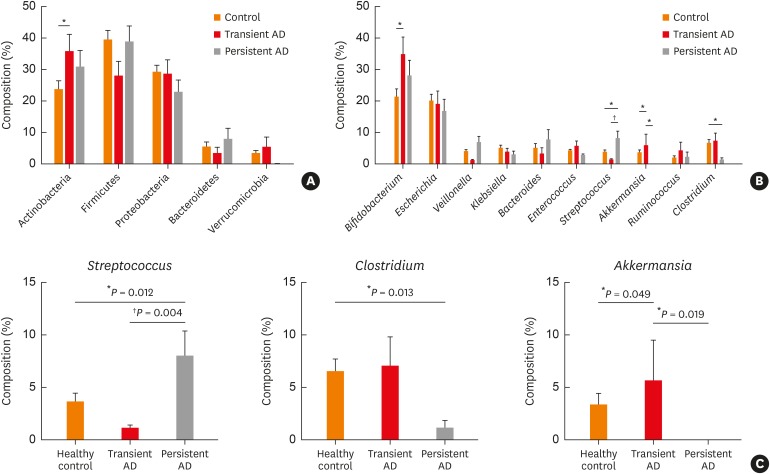
Fig. 2. Phylum and genus compositions of the gut microbiota of the infant subjects. Comparison of bacterial (A) phylum and (B) genus in each group expressed as the mean diameter ± standard error with the P value. Orange denotes the healthy control group, red denotes the transient AD group, and gray denotes the persistent AD group. (C) Comparison of the Streptococcus, Clostridium and Akkermansia compositions within the gut microbiota. The significance of any differences between groups was tested using the Mann-Whitney U test.
AD, atopic dermatitis.
*P < 0.05; †P < 0.01.

