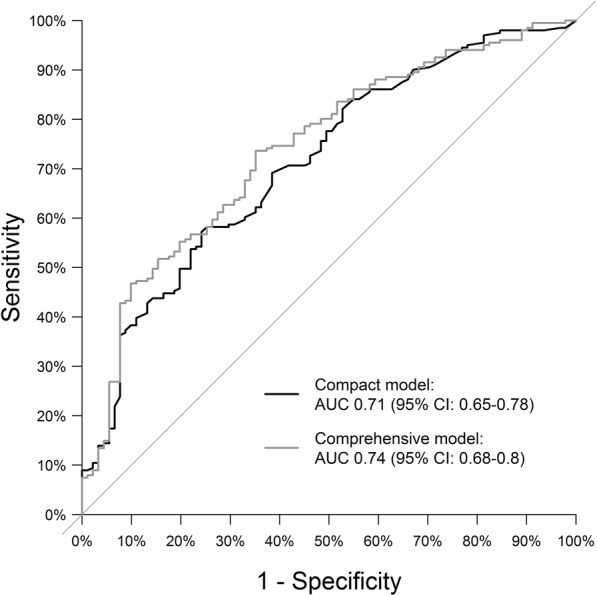
Fig. 2.

ROC curves of the prediction models. The black line corresponds to the compact model, and the grey line to the comprehensive model (AUC, area under the curve; CI, confidence interval; p-values comparison to AUC = 0.5)

ROC curves of the prediction models. The black line corresponds to the compact model, and the grey line to the comprehensive model (AUC, area under the curve; CI, confidence interval; p-values comparison to AUC = 0.5)