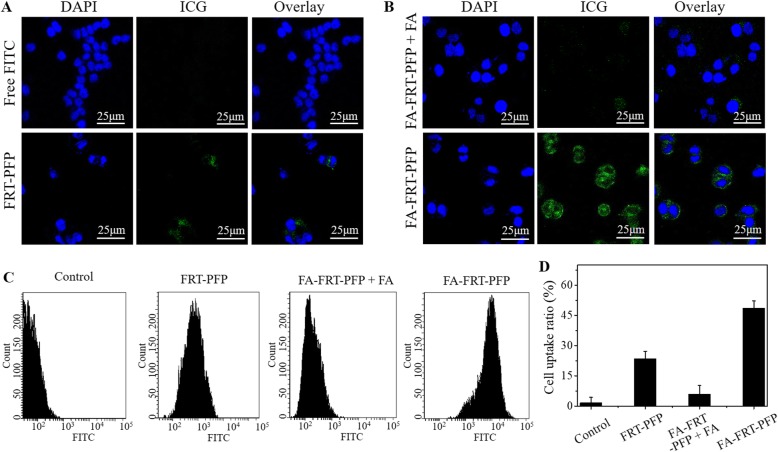
Fig. 5.
Cellular uptake. a, b The confocal fluorescence images of cells treated with free FITC and FITC-labeled FRT-PFP, FA-FRT-PFP + FA, and FA-FRT-PFP. Green and blue colors represented FITC and DAPI fluorescence, respectively. Scale bar = 25 μm. c, d The FITC fluorescence signal and the corresponding statistical data inside cells treated with free FITC and FITC-labeled FRT-PFP, FA-FRT-PFP + FA, and FA-FRT-PFP

