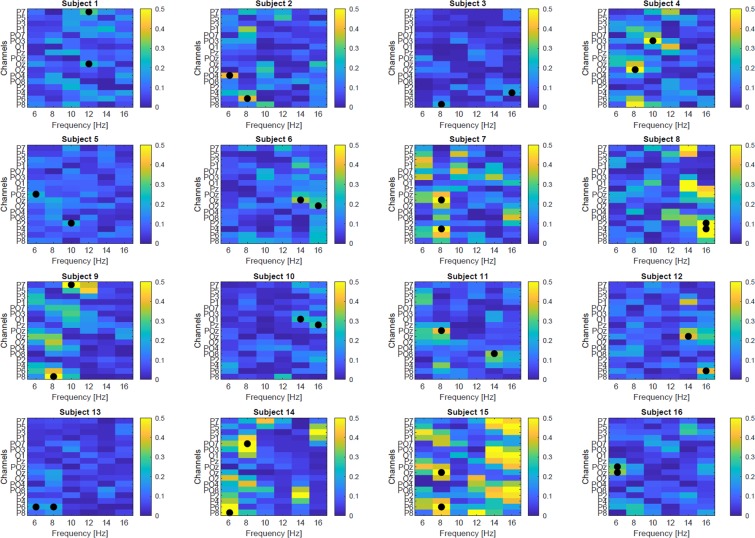
Figure 12.
Feature discriminancy maps per subject computed on the 8 runs. Bright color (yellow) indicates high discriminancy between bottom-left and bottom-right CVSA task. The discriminancy of each feature (channel-frequency pair) is quantified as the Fisher score of the PSD for the two CVSA tasks. For each subject, the two most discriminant features are marked with black circles and they have been used as input for the PSD classifier.

