Figure 4.

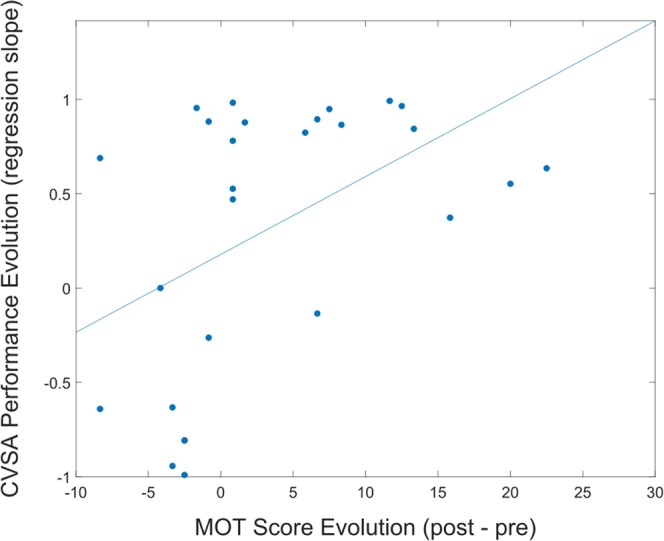
Graph representing the correlation between MOT score evolution and CVSA performance evolution during a session [Spearman correlation test - r = 0.5169, p ≤ 0.01]. This graph includes 2 points per participant, i.e., one per session.

Graph representing the correlation between MOT score evolution and CVSA performance evolution during a session [Spearman correlation test - r = 0.5169, p ≤ 0.01]. This graph includes 2 points per participant, i.e., one per session.