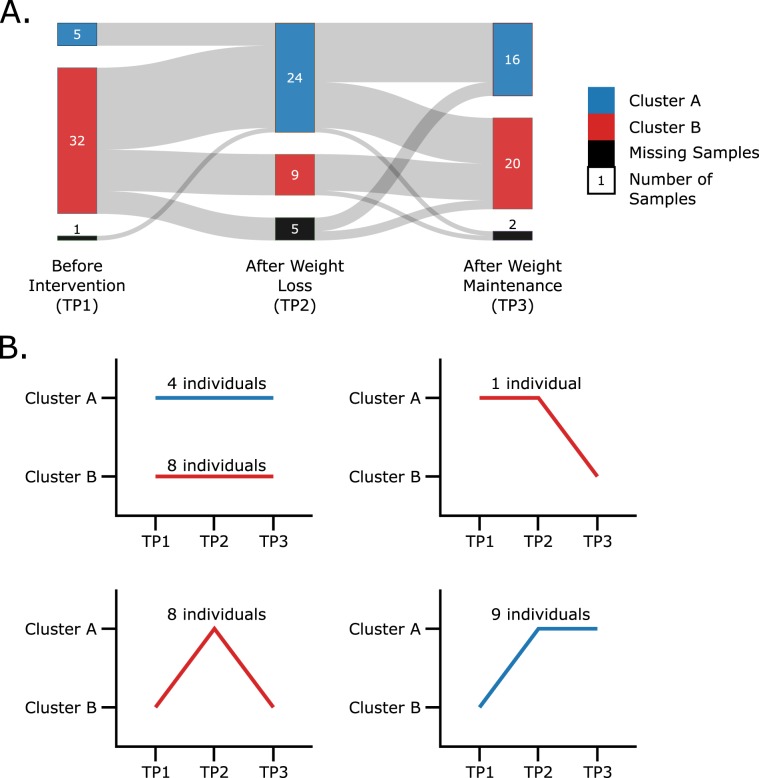
Figure 1.
(A) Sankey diagram showing the proportion of individuals changing or not changing clusters across the time points of the dietary intervention. Eight individuals had missing samples at different time points and thus, were not clustered at those time points. These samples are shown as black blocks at the respective time points. (B) The various cluster membership patterns of the thirty individuals observed across the three time points, as well as the respective number of individuals following said pattern.

