
Fig. 1. Percent free from Alzheimer’s dementia.
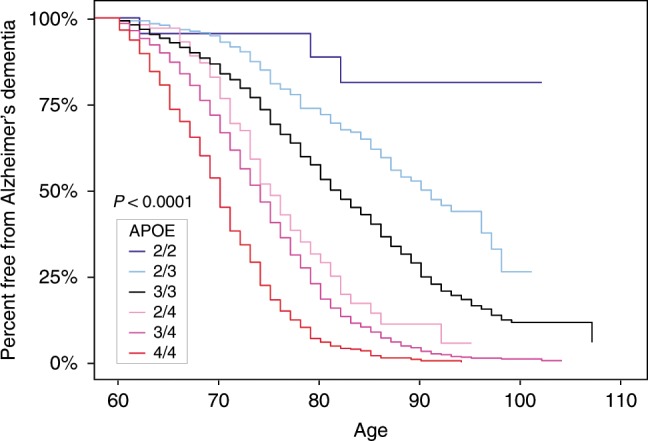
Kaplan–Meier curves were generated from Alzheimer’s dementia cases and cognitively unimpaired non-AD controls in the neuropathologically confirmed group. Y-axis represents the percentage of persons with each APOE genotype in the neuropathologically confirmed group who remained free from Alzheimer’s dementia. X-axis denotes age at death for controls and age at onset of cases, while replacing with age at death when age at onset was unavailable.