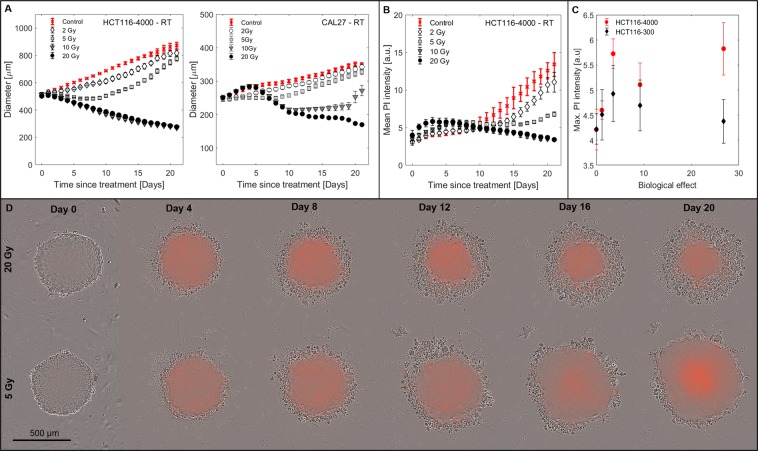
Figure 3.
Spheroid response to RT. (A) Growth curves for HCT116-4000 and CAL27 spheroids following RT treatment 96 h after seeding. (B) Mean PI staining intensity as a function of time after irradiation for HCT116-4000 spheroids. (C) Peak mean PI intensity measured after RT (days 0–7) for HCT116-300 and HCT116-4000 spheroids plotted as a function of the biological effect showed poor linear correlation (, ). (D) Phase contrast images overlaid with PI fluorescence snap-shots from time-lapse imaging of representative examples of HCT116-4000 spheroids irradiated with 20 Gy or 5 Gy. Irradiated samples showed faint PI staining throughout and retained a dense structure. Cells were continuously shed from the outer spheroid layers until regrowth occurred. Means and standard errors of the mean of at least three independent repeat experiments are shown in A to C ().

