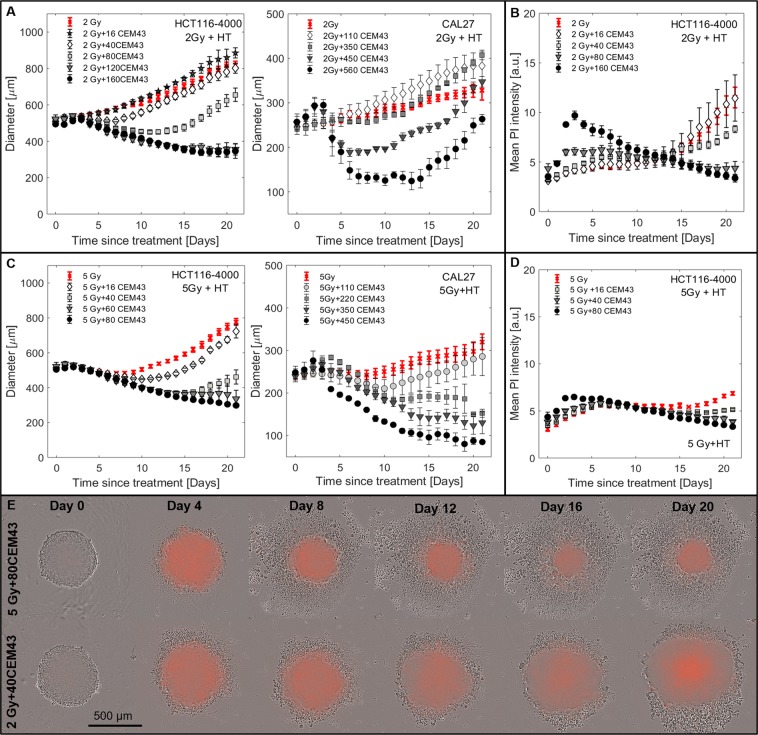
Figure 4.
Spheroid response to RTHT. (A,C) Growth curves for HCT116-4000 and CAL27 spheroids following RTHT treatment 96 h after seeding. Combinations of HT (16 to 560 CEM43) with 2 Gy (A) or 5 Gy (C) are shown. (B,D) Mean PI staining intensity as a function of time after RTHT exposure (HCT116-4000 spheroids). (E) Phase contrast images overlaid with PI fluorescence snap-shots from time-lapse imaging of representative HCT116-4000 spheroids treated with 5 Gy + 80 CEM43 or 2 Gy + 40 CEM43. Means and standard errors of the mean of at least three independent repeat experiments are shown in A to D ().

