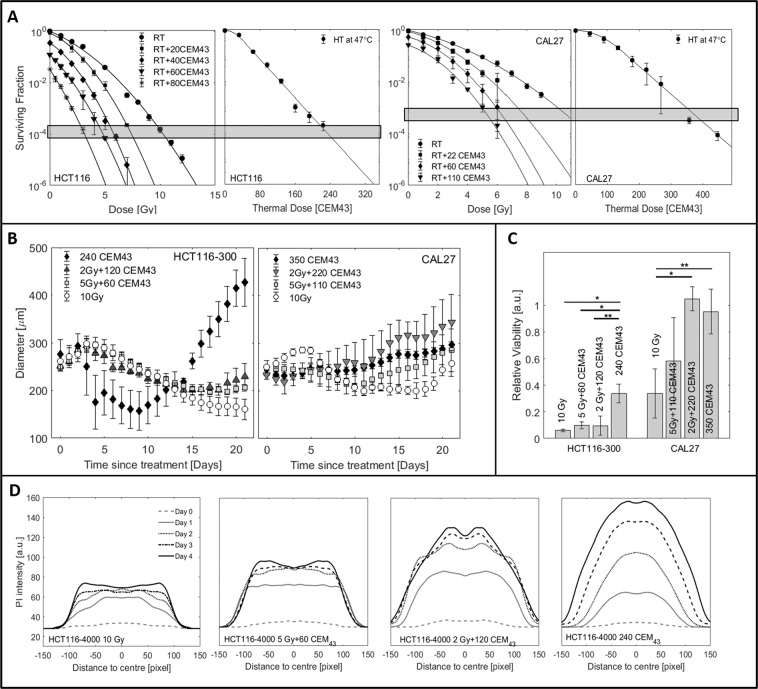
Figure 6.
Comparison of growth responses after isoeffective treatments having the same 2D clonogenic survival fraction, delivered by either RT, HT or a combination thereof. (A) Clonogenic survival (mean values and standard deviations of at least three repeat experiments ()) of HCT116 and CAL27 cells as a function of radiation or thermal dose. BEQD levels seen for 10 Gy RT are indicated as horizontal boxes. (B) Growth curves for HCT116-300 and CAL27 spheroids. Mean values and standard errors of at least three independent experiments are shown. (C) Cell viability measured by Cell-Titer-Glo3D 21 days after treatment of the samples shown in B. *p < 0.01, **p < 0.05. (D) Spatial distribution of PI staining within representative examples of treated HCT116-4000 spheroids. The x-axis indicates the distance in pixels from the spheroid centre of mass.

