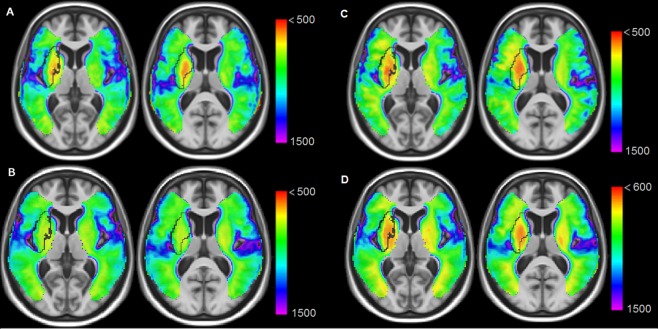
Figure 3.
Average ADC maps for patients with deep (A), superficial (B) and territorial stroke (C). The whole sample is shown in (D). Dark lines contour the IBZ estimate (from the chronic patient sample). Warmer colors indicate more important ADC reductions (units are 10−6 mm2/s). For display purposes, regions with normal ADC values are not displayed (>0.0015 mm2/s). Stronger ADC decreases are within the IBZ, especially for patients with territorial stroke (C).

