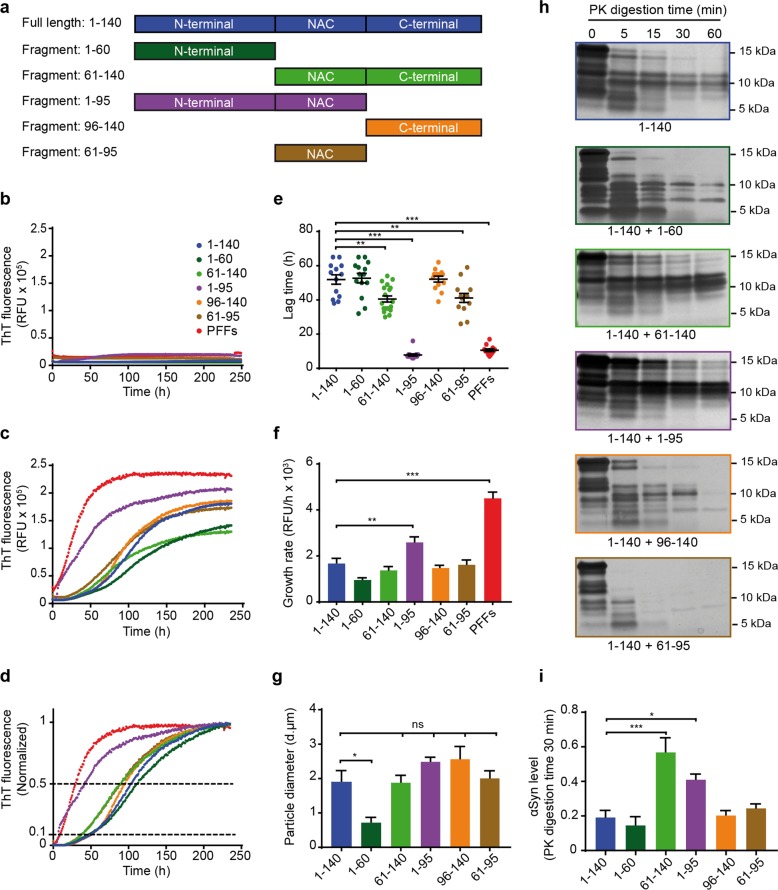
Fig. 3. Recombinant αSyn fragments show differential effects on aggregation of full-length αSyn in a cell-free aggregation assay.
a Schematic overview of recombinant FL-αSyn and fragments used in the study: Full length (1–140), N-terminal fragment (1–60), NAC + C-terminal fragment (61–140), N-terminal + NAC fragment (1–95), C-terminal fragment (96–140) and NAC fragment (61–95). The same names and color-code are used in all the panels. b–d Seeding effect of recombinant αSyn fragments on recombinant FL-αSyn in a cell-free aggregation assay. For the aggregation reactions, different fragments described in a were used as seeds and FL-αSyn was used as a substrate at a molar ratio of 1:10, respectively. Aggregation kinetics was monitored by measurement of thioflavin T (ThT) signal. αSyn pre-formed fibrils (PFFs) were used as positive control for seeding. RFU: relative fluorescence unit. Aggregation curves of αSyn fragments without addition of FL-αSyn substrate are shown in b. Aggregation curves with addition of FL-αSyn substrate as raw fluorescence data are shown in c, and normalized fluorescence ratio data from c are shown in d. The lower (0.1) and the upper (0.5) fluorescence thresholds of the total signal are shown with dotted lines. Aggregation curves are presented as mean from at least 3 repeats with 3 technical replicates each. e Lag time of aggregation seeded with different αSyn fragments. Lag times are presented as the time at which each curve reached 10% of the total fluorescence signal. Lag times were strikingly reduced in aggregation reactions seeded with PFFs and fragment 1–95. Each dot of the scatter plot represents one aggregation curve. Data are presented as mean ± SEM from at least 3 repeats with 3 technical replicates each (black lines). **p < 0.005, ***p < 0.001; one-way ANOVA with Tukey’s post hoc test. f Growth rate of aggregation seeded with different αSyn fragments. Aggregation growth rate is presented as a measure of increased ThT fluorescence per hour. Growth rates were significantly higher in aggregation seeded with the fragment 1–95 and the PFFs (positive control), and remained unchanged in all other aggregation reactions. Data are presented as mean + SEM from at least 3 repeats with 3 technical replicates each. **p < 0.005, ***p < 0.001; one-way ANOVA with Tukey’s post hoc test. g Particle size of aggregates seeded with different αSyn fragments. Particle size of aggregates was measured with dynamic light scattering (DLS) after the aggregation reactions were finished. Except for fragment 1–60, which resulted in significantly smaller fibrils, no significant differences in fibril size were observed across the rest of the samples. Data are presented as mean + SEM of particle diameter (d.nm) from at least 3 repeats. *p < 0.05; one-way ANOVA with Tukey’s post hoc test. h, i Proteinase K (PK) resistance of aggregates produced by seeded aggregation with different αSyn fragments. Aggregation was carried out with the same molar ratio of seed to substrate (1:10) as described above. PK digestion was performed at 37 °C for the indicated amounts of time. Protein separation by gel electrophoresis followed by silver staining revealed that aggregates seeded with fragments 61–140 and 1–95 were more PK resistant than the other samples. i A normalized optical density quantification of αSyn digestion at 30 min. Data are presented as mean + SEM from at least 3 repeats. *p < 0.05, ***p < 0.001; one-way ANOVA with Tukey’s post hoc test.

